


Over the years at Foundamental, we have looked at a very large number of B2B commerce plays. A vast majority of them were in emerging markets, where this model has worked out particularly well for us: we have been fortunate enough to back a handful of genuine category creators (Infra.Market, Metalbook), and a few more that we hope will get there soon.
I have personally seen 100+ of these companies and worked on many of these deals. Somewhere along the way, the rules of thumb I kept reaching for hardened into something more deliberate: a set of benchmarks I use to evaluate whether a company's economics are bad, fine, good, or genuinely special. This piece is an attempt to write those down and share them, in the hope that they are useful to founders building in the space and to peers looking at it.
A big thank-you to my colleagues Shubhankar Bhattacharya and Patric Hellermann, whose perspective helped sharpen what follows.
One scoping note before we start. What I am describing here are not pure marketplaces that simply connect demand and supply and clip a referral fee/take rate. I am talking about managed marketplaces (businesses that act as the supplier of record and own the messy middle: logistics, distribution, financing, quality, fulfillment) and cloud-manufacturing platforms (if you don’t know what these are, I suggest you have a look at our pieces: here, here, and here). The economics of those two models are different enough from a “listings business” that most generic marketplace benchmarks simply do not apply.
Taxonomy

Before we get to the benchmarks, we need to agree on what we are even measuring.
For example, one thing that truly puzzles me is the liberty that founders take in naming their revenue/GMV: annualized revenue from selling materials is not ARR, and monthly revenue is not MRR. I see this quite often, lately: a company moves steel, or cement, or tiles, or whatever, and reports its annualized top line as "ARR" because it makes the number sound recurring and SaaS-like to investors. It is bullshit. There is nothing recurring about a one-off materials sale: a customer who buys a truckload of rebar this month is under no contractual obligation to buy another next month. Hence, call it what it is: this is GMV, and where you are the supplier of record, GMV is your revenue.
With that out of the way, here is the full vocabulary we’ll need later on:

With the taxonomy out of the way, let’s get into the gist of it: the benchmarks. I group them into three main categories.
The benchmarks

These are benchmarks built up over years of interacting with several tens of B2B commerce companies in the project economy: firsthand, from sitting on company boards, reviewing data rooms, and working on deals. They are calibrated against the full spectrum we have seen: the worst and the very best in the market.
Two things to keep in mind as you read them.
First, the tiers are deliberately demanding at the top, e.g. "Great" and "Exceptional" are reserved for outcomes that are genuinely rare.
Second, a single scale has to stretch across two very different business models. For example, a 6% CM1 on a fast-rotating commodity marketplace and a 30%+ CM1 on a branded specialty play both live on the same ruler here, which means a strong commodity business will often read as merely "Good" on raw margin while potentially looking far better once you account for capital efficiency. That is a feature, not a bug → read the families together, never one in isolation.
Unit economics benchmarks

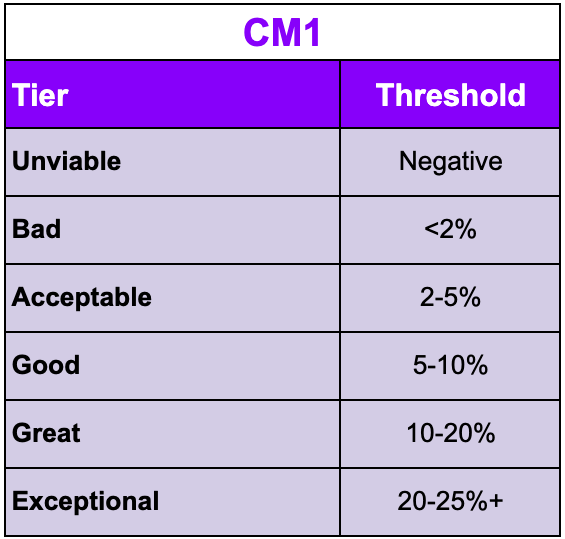
This is the P&L waterfall: what you keep per unit of GMV after materials, then after logistics and the other variable costs, then after everything.
Here is the important part: I almost never look at gross margin or contribution margin on their own. They are useful as a directional signal, not as a verdict. A negative gross margin is genuinely bad, since it means you are subsidizing transactions, and scaling only digs the hole deeper. As a matter of fact, it might get very hard to get out of that hole if you start from there.

A low gross margin, on the other hand, tells me very little in isolation. A thin margin has to be read against the category the company operates in: if it is a commodity business, then of course the margin is thin; that is the nature of commodities, and it is not a mark against the company or vertical it operates in. In fact, an unusually high margin in a commodity category is a strongly positive signal, since it means the company is extracting more than the category generally allows, which is exactly what you want to see.
The reverse is the real red flag: a company operating in a category that should support a healthy margin, but pulling a poor one. Read relative to its category, gross margin is really a proxy for how much value a company actually adds, and where it sits in the value chain. A margin below what the category should yield is often the tell that the company is not sourcing upstream at the manufacturer level, but is simply another intermediary (e.g. sourcing from distributors) passing goods along, capturing a sliver and adding little. The companies that earn above-category margins are usually the ones that have done the hard work of going up the chain, e.g. buying direct, owning more of the transformation, cutting out the layers between them and the source. So when I see a margin that is low for its category, my first question is not "is this a bad business?" but "what is this company actually doing in the chain that justifies its existence?". And the follow-on question is whether I can underwrite the margin getting better: thin(er) margin today is acceptable if there is a credible path up the value chain → what you should assess is not the current number in isolation but whether the company can move itself to a structurally better position over time.
Leaving this aside, never read gross margin in isolation, and as you will see in the next family, a thin headline margin can hide a genuinely excellent business.
For CM1, the same considerations as above hold.
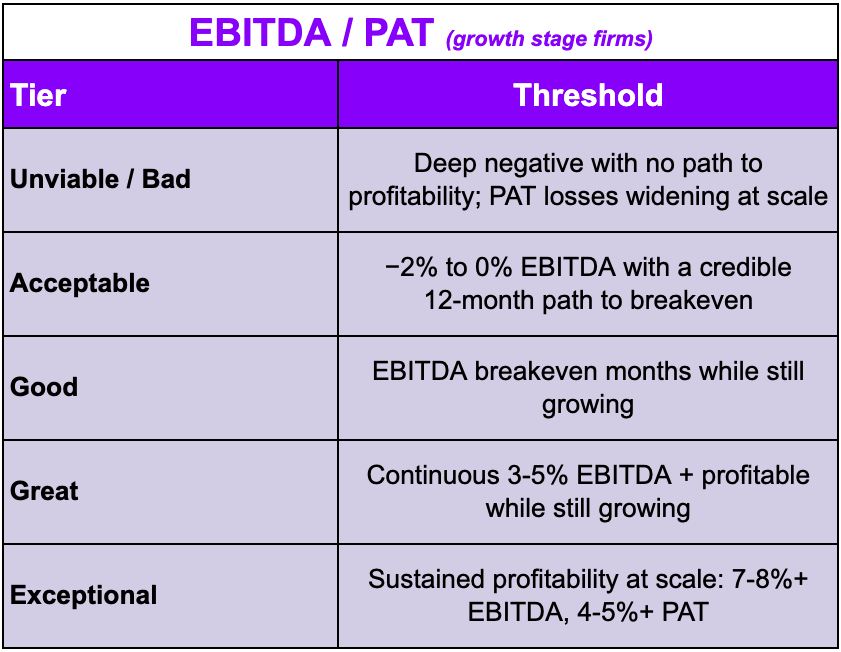
On profitability, the bottom of the waterfall: because these businesses (generally) do not need to build a great deal of technology, they can (and should) become profitable remarkably early in their journey. I do not expect profitability at pre-seed, seed, or Series A. But by the time a company is at Series B and operating at some scale, I expect profitability to be either something it has already reached at the EBITDA level, or something clearly within its grasp. And at real scale, the question stops being whether these companies can be profitable and becomes how profitable, which is a different framework entirely.
Capital efficiency benchmark

If I had to evaluate one of these businesses through a single lens, it would be through benchmarks in this category. The question that matters is not "how fat is the margin?" but "how hard does every dollar of capital work?".
And the place that question lives is working capital. So before anything else, let's talk about why a long working-capital cycle is the silent (momentum) killer of these businesses. The logic is obvious: a long cycle means that to grow, you need a ton of capital tied up in the business at any given moment, and that capital has to come from somewhere. Early in the journey of a company, it mostly can't come from many places: you have little leverage to raise debt against, and the credit instruments built for this (e.g. working-capital financing) are hard to access at any sensible cost until you have scale and a track record. So a long cycle, early in the journey, means that you simply run out of cash before you run out of demand.

It's worth understanding why the cycle gets long in the first place. For example, early on, you have no leverage over your suppliers, so they make you pay upfront, or close to it → cash out the door before you've sold and collected anything. At the same time, you usually have to extend credit to your customers: in fact, financing the buyer is one of the genuine value-adds of a B2B commerce play, so this is not something you can simply refuse to do. And on top of both, your model might require you to hold inventory, although the best marketplaces avoid this almost entirely, operating on a dropshipping or just-in-time basis (that said, this is not absolute: in more complex product manufacturing, you may genuinely need to hold inventory of input materials, e.g. to protect against supply disruptions, to guarantee lead times, or because securing the right inputs is itself a source of differentiation). (It's normal and expected that cycles to sit on the longer end for cross-border plays, almost by construction: goods spend weeks in transit and at customs before they can even be invoiced, suppliers in one jurisdiction want payment terms your customers in another won't mirror, and the trade-finance instruments that bridge the gap add cost and friction of their own.)
But this is exactly where the more important question lives: at scale, does any of this change? When the company grows into a position where it can buy capacity directly from manufacturers, do its credit terms with suppliers improve? Does the inventory it carries shrink as forecasting and forward visibility get better? A working-capital cycle that looks mediocre today is a very different proposition if you can see a credible path to it tightening as the company scales.
That said, my favourite metric is ROCE. The higher it is, the better the deal, full stop, because it tells me that the more money I put into the company, the more money I get out, which is really the whole game in a capital-intensive, working-capital-hungry business.
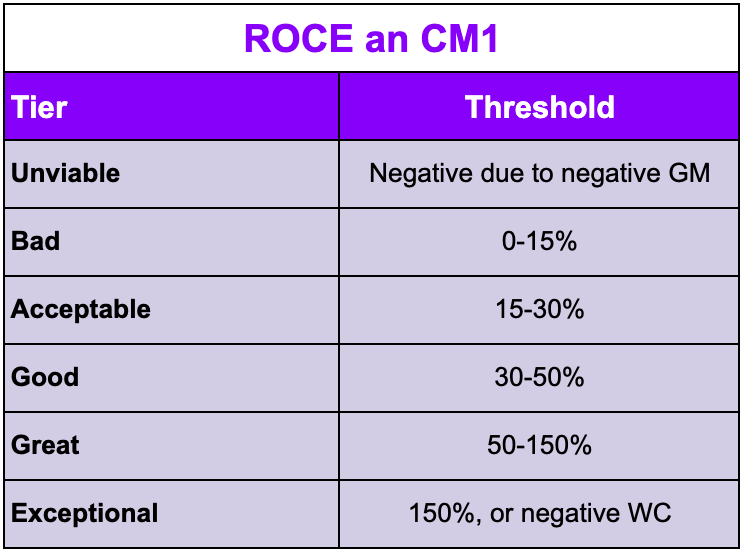
This is also exactly why low margins do not scare me when the working-capital cycle is short. Consider two businesses. One earns a fat (say, 25%) margin but ties up cash for 50-60 days on every transaction. The other earns a thin(ner) margin (say, 7%) but collects in 5-10 days. The second business can rotate the same dollar of working capital six or three times a month.
Take it to the limit and the logic gets even cleaner. If you run negative working capital (your customers pay you before you pay your suppliers) then growth is no longer constrained by capital at all (the main bottleneck for this model). You are literally funding your expansion with other people's money. In several of the geographies we operate in, this is close to the only way to build a sizeable B2B commerce business, because local debt markets cannot reliably finance a long working-capital cycle at any sensible cost.
The corollary is that ROCE is a capital-allocation compass. In the context of a multi-product marketplace, once you can measure return on capital per segment, you stop treating the business as one blended P&L and start steering working capital toward the verticals that earn the highest return on it, e.g. pulling capital out of a 20%-ROCE commodity line and pushing it into a 35-45%-ROCE specialty one then cash is tight.
The remaining three metrics in this family zoom out from the unit level to the whole company. Where ROCE asks how hard a single dollar of working capital works inside the cycle, these three ask how much you got, in aggregate, for all the money you ever consumed. They exist because a GMV chart on its own is a vanity exhibit → it tells you a company got big, not whether it got big efficiently. These are, if you wish, a reality check.
The capital efficiency ratio (annualized revenue over cumulative equity raised) is the simplest version: how much top-line scale did you generate for every dollar of equity your investors put in? A company doing $100M of annualized revenue on $7m of equity raised is a fundamentally different animal from one doing the same $100m on $50m raised, even though their GMV charts are identical: the first built something, the second “bought” it. This is the number you can use to cut through an impressive-looking topline and ask what it actually costs to get there, and what it will cost to scale.

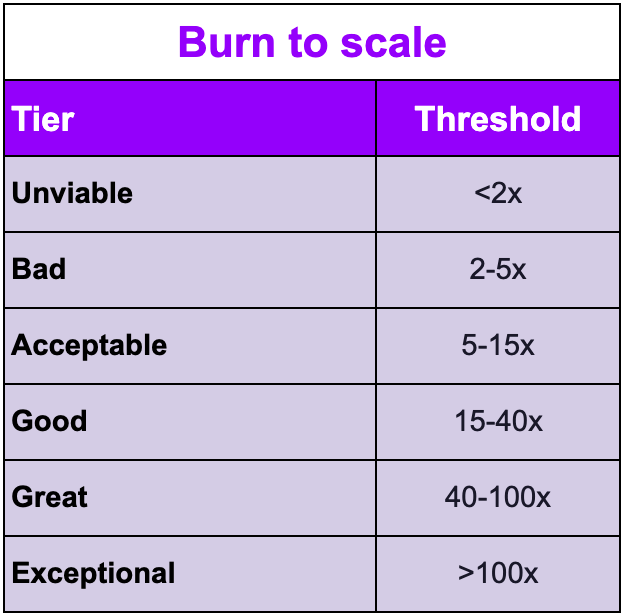
Burn-to-scale is the close cousin, but with a sharper denominator: equity raised and cash burned are not the same thing → a disciplined company can raise a large round and sit on most of it, or lever its equity into debt, so its capital efficiency ratio understates how lean it really is. Burn-to-scale strips that out and measures scale against the cash you actually lost getting there. It is the truest test of how little you needed to spend to build what you built.
One caveat: because this ratio is revenue-based, it structurally flatters thin-margin businesses. You might object that this self-correct, e.g. less margin means less opEx coverage, hence more burn, hence a lower ratio, and within a model class it largely does. But across models it doesn't, because a revenue dollar is simply worth more margin in one business than the other: a "branded play" at 25% CM1 posting a "modest" 12x is generating more contribution margin per dollar burned than a 3% commodity marketplace at 40x. So read the thresholds with the margin profile in mind.
The burn multiple is different in kind, as it is a flow metric: for every dollar I burned this period, how much durable contribution margin did I add? Two things make it the most honest of the set. First, it is marginal → it catches the company that was efficient historically but is now lighting money on fire to buy its next leg of growth. Second, the numerator is CM1, not GMV → it rewards adding good margin, not vanity top-line.

Growth benchmarks

If unit economics tell you whether the model works on a single transaction, and capital efficiency tells you how hard your money works, cohorts tell you something more fundamental: whether you are just a convenient place to transact once.
Acquiring a customer is expensive, keeping one is cheap. So the entire engine of a marketplace (and any other business, really) runs on whether customers come back: a cohort that decays is telling you that you won a customer once and then lost them, which means you are paying full acquisition cost over and over just to stand still. And there is a deeper message buried in that decay: if buyers don't come back, it is usually because you are not their default → you are their spot option, the place they go when their usual supply chain has a gap, not the place they route their procurement through by habit. A spot marketplace has a naturally low ceiling. To grow, you must out-acquire your churn rate forever, so growth becomes a function of acquisition spend rather than a compounding base of loyal demand.
In a way, cohorts are a proxy of a company's true addressable market. Retention is a triangulation signal: it tells you how large your real market is based on how much of it perceives genuine value in you. Note that you have to track cohorts two ways at once: in GMV (value) and in logos (count). They tell you different things, and the gap between them is itself a signal → a handful of growing accounts can prop up value-based NDR while your logo count quietly bleeds out, so a business can look like it's expanding on a GMV cohort chart even as it's churning customers underneath. Hence, I also like to analyze cohorts on a single customer basis. Expansion (net dollar retention above 100%, where your existing base spends more with you over time, often as you add categories) is the positive version of the same signal: proof you are winning a growing share of your customers' wallet, which is exactly what earning a real position in their procurement looks like.
And wallet share is the first domino in a waterfall: the more of a customer's spend you capture, the more volume you push through your suppliers → the more volume per supplier, the better the terms and priority you command → better terms make you a more competitive proposition to the next buyer → which wins you more customers → which sends still more volume through your suppliers. That flywheel is how a marketplace converts retention into durable pricing power. Which is precisely why cohorts matter as much on the supply side as on the demand side. Run the same analysis on your vendors, and you should want vendor cohorts that are stickier than customer cohorts, not weaker, because suppliers, unlike project-based buyers, produce continuously and live in fear of underutilised capacity. If you were a genuinely valuable channel to them, they would consolidate around you. So when vendor retention decays as fast as buyer retention, it is the more damning of the two readings: it says you have not become a meaningful sales channel for your own supply base, and without that there is no supply-side lock-in and no durable pricing advantage to hand back to buyers. (Note: success in this model is, in fact, not in maximizing liquidity on the supply side!)
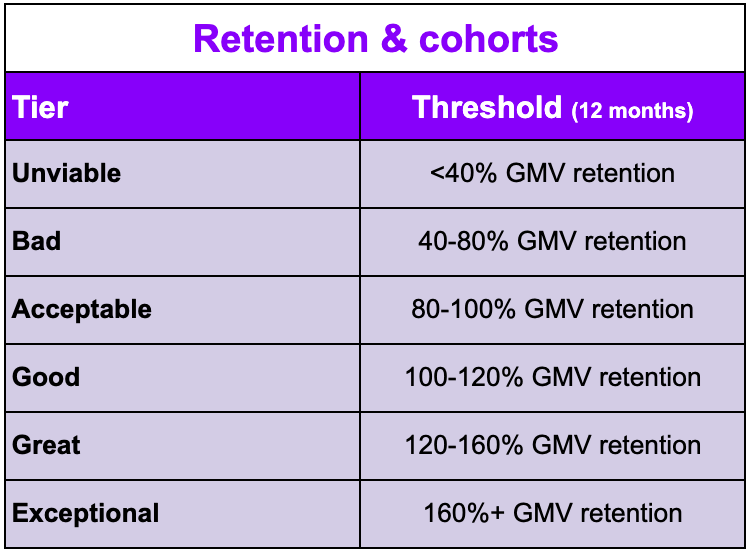
Now, a warning about how cohorts get misread. The seductive move is to look only at the survivors: strip out everyone who churned, point at the accounts that remain, and show that they expand their spend year over year ("look how our retained customers grow"). That is real information and worth having. But it throws away the entire reason you run cohorts in the first place, which is to measure three things at once: 1. Whether you targeted the right customers (an indicator of how cheaply you can grow); 2. Whether you actually retain them (the same); and 3. Most importantly, to triangulate your true market size and how much of the broader market genuinely values you. The survivor view smuggles in an assumption: that survivor-type accounts can be acquired and scaled at will. But if that were true, you have to answer an awkward question: what has stopped you, until now, from simply becoming a better picker of survivors? Either you can learn to select for them, in which case why haven't you, or you can't reliably identify them up front, in which case you are paying full freight for a stream of accounts that don't survive, and you are now betting you can grow super-efficiently despite that leakage.
There's a related subtlety the survivor view hides: a single blended cohort curve usually contains two different populations pulling in opposite directions. There's a transactional segment that uses you as a spot market (small orders, here once and gone, and the first you deprioritise the moment working capital is tight) and a sticky segment that has wired you into its regular procurement and accounts for almost all of the expansion you can see. The trap is that the sticky segment's rising order values are real and easy to point at, while the spot segment quietly sets your aggregate retention. You can have genuinely deepening wallet share among the customers who stay and still sit well below 100% NDR at the cohort level, simply because expansion among the few never clears the drag from churn among the many. So always ask which population you are actually scaling → if the majority behaves like spot buyers, the expansion story is a rounding error sitting on top of a leak. (Note, too, that this links straight back to capital efficiency: the very working-capital scarcity that pushes a company to optimise for fast-paying customers can quietly select for spot buyers, so retention and capital rotation sometimes pull against each other).
I’ve also heard many times, when the cohorts are weak, that the decay is deliberate: founders were pruning low-quality customers, optimising for capital rotation and ROCE, concentrating on better-rated accounts with cleaner payment behaviour. Sometimes that's partly true. But it's also the most convenient story available, which means it won't be taken on faith → as a founder, expect it to be stress-tested, and stress-test it on yourself first. Here is how I would pressure it.
First, if a real strategic pivot were driving the decline, recent cohorts should look structurally different from older ones → a visible break in the curves. If the newest cohorts decay on the same slope as the oldest, the "we changed who we select" story doesn't survive contact with the data.
Second, you should triangulate the claim against a metric that it would necessarily move. If the story is "we're shifting to higher-quality, faster-paying accounts", then working-capital days should be falling. If WC days are flat or worsening over exactly the window the pivot supposedly covers, the claim and the numbers point in opposite directions → and the numbers win.
Third, interrogate your own incentive. If working capital is your scarcest resource and you choose where it goes, why would you systematically onboard "bad" customers only to trim them later? That is squandering the one thing you can least afford to waste. The more honest reading is usually subtler and less flattering: optimising for capital rotation is entirely rational, but its side effect is that you select for customers who are easy to serve and quick to pay, which is very often the same thing as selecting for spot buyers who were never going to stay. You can optimise your way into a spot marketplace without ever deciding to build one.
Since logo retention is the other half of the pair, here is the ruler I use for it. Three definitional rules first, because this is the metric founders game most creatively. It must be transaction-based: a customer who is "active on the platform" but hasn't bought anything is not retained, and I have seen the same company report 90% retention on an activity basis and 40% on an invoiced basis for the same period. It must be annual: in project-driven categories, buyers procure quarterly or lumpier, so a monthly logo curve reads as churn when it is merely cadence. And it must cover the full cohort (no survivor filtering, for all the reasons above).

One last caveat, so you don't over-read decay. Early in a marketplace's life, and in project-driven categories especially, cohorts can be genuinely lumpy. What you must not accept is a steady decline-and-stabilise-lower pattern dressed up as "our customers just buy lumpily".
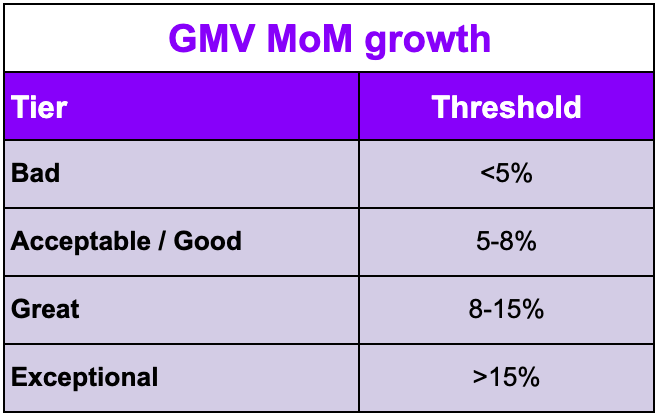
Last, a word on what these MoM growth numbers mean. When I quote a "great" or "exceptional" MoM figure, I am talking about an early-stage company. Growing 5x at $1Bn of scale is basically impossible, so MoM growth decays with scale as a matter of “physics”. So, read the velocity benchmarks as a sliding bar. Early on, raw MoM growth is a very informative signal. That said, never forget about the quality of the growth (the cohorts and NDR from the previous section, the margin and capital efficiency underneath it).
Other factors

A few things sit alongside the benchmarks above and shape how I read them.
The first is market size. Every investor obsesses over it, and for good reason: it is very hard to get excited about a market measured in a few hundred millions. Everyone is looking for the big one. But you should not be swayed by the headline number alone: a large TAM is necessary, not sufficient. What matters just as much is whether the market is homogeneous and efficiently addressable. A homogeneous market is one where customers broadly want the same things, so a single product and a single playbook can serve a great many of them. A heterogeneous one (where every customer has different needs, different specs, different ways of buying) is a trap dressed up as an opportunity: you end up adding cost and complexity in lockstep with revenue, bespoke-serving one account at a time, and you never earn the operating leverage that makes scale worth having. So when I look at TAM, I am really asking two questions at once: how big is it, and how much of it can one company actually serve with one repeatable motion?
The second is the expansion opportunity. The question is simple: once you have landed a customer with your initial wedge, is there room to extract meaningfully more value from them over time, or is this a one-product play? The best businesses here land with a specific product for a specific customer, and then they expand along several axes at once. For example, on the demand side, they sell more categories to the same buyers, because a single product rarely captures enough of any customer's wallet, and each additional category deepens the relationship. On the supply side, they give their existing suppliers more to do → products that have synergies between raw materials/processes, so widening the catalogue is also a way to become a bigger, more important customer to your own supply base. And some expand upstream, into the input materials themselves, which not only opens a new revenue line but improves their cost position on everything downstream. The common thread is that every one of these is a new monetisation avenue that increases wallet share with customers or suppliers you already have, which is exactly the machinery behind cohorts that expand past 100%. You cannot build durable, compounding NDR on a single product only: you need somewhere to grow into.
The third is AOV, which sounds mundane but quietly determines whether the model can scale at all. Very small orders are very hard to build an efficient business on: the overhead of serving an order doesn't shrink proportionally as the order does. Worse, small volumes give you no leverage: you can't aggregate enough demand to engage suppliers at the manufacturer level, which is precisely where the better pricing and the real margin live. The best version of this is usually enterprise demand → large, repeat orders that justify the cost to serve, give you the volume to negotiate upstream, and let you build the kind of stable, profitable relationship that small-volume buyers never will.
The fourth is the loan book, wherever credit is part of the model. Some (most) of these businesses earn a real share of their economics from “financing” the transaction (extending credit). Where that is the case, the financing operation has to be underwritten as carefully as a lender would underwrite it → NPAs and write-off rates, how much debt each dollar of equity unlocks, net debt-to-equity against covenants, the share of the book that is secured, and the leverage structure itself.
Beyond these, there is a layer of more qualitative, structural judgement that I won't belabour but that sits underneath everything above. In essence, you want to be operating where the market structure actually allows a new intermediary to add value, which means fragmented supply: avoid categories where ten or fewer incumbents own 70-80% of the market, or where manufacturers have no utilisation problem to solve, because there you have no gap to fill and no leverage to win. Also, if quality is already standardised and supply is dependable, there is little for you to improve and little reason for anyone to switch, and you end up solving a convenience problem rather than a real supply one. And it means the right position in the chain (the same point the gross-margin discussion made earlier) it to source upstream at the manufacturer level, because buying from intermediaries hands away both margin and quality control and leaves you as a redundant layer rather than a participant that actually changes the economics.
Conclusions

None of this is gospel.
They are benchmarks I have extracted over years of looking at these businesses from the inside, through one fund's lens (primarily emerging-market, project-economy, a particular vintage of deals) and they will keep evolving as we see more. But if they help a founder reason a little more honestly about their own numbers, or save a fellow investor from mistaking a fat margin for a good business, they will have done their job.
Let me know your thoughts!
A last closing note: I am aware this piece leaves a few things open. If you have read this far, you are probably already asking the next questions:
- Do these businesses cluster into archetypes (e.g. the enterprise-heavy cloud manufacturer, the cross-border distributor, etc.), and how does each one typically read across the full set of benchmarks?
- If you are a founder and one of your metrics sits outside the desired range, what can you actually do about it?
- What are some of the notable examples we have seen in the market, and what were their ingredient?
- What is the most common bad model out there?
- And more...
Cramming all of them (and more) in here would have doubled the length of an already long piece and diluted its purpose, which was to put the benchmarks themselves on the table. So consider this the foundation. I will be covering many of the points above in future pieces, so I suggest you follow along and subscribe to the newsletter not to miss them!
More appetite for this type of content?
Subscribe to my newsletter for more "real-world" startups and industry insights - I post monthly!