

%20(4).png)

Foundamental's State of the Project Economy, a data-driven view of where construction stands in 2026.
The report covers 100+ pages of original research, third-party data and our own analysis across five chapters: market context, new demand drivers, structural bottlenecks, capital flows, and what we look for in this market.
The headline numbers are familiar to most in the industry. Global construction spend hit $15 trillion in 2024, growing at 5.6% CAGR. Productivity has grown at 0.4% per year since 2000. Eight of the ten largest contractors in the world are Chinese state-owned.
What this report tries to do is go one layer deeper.
It traces why the West fell behind, from banks moving capital out of industrial production into derivatives, to the 6 million US manufacturing jobs lost as global trade doubled. It documents the four structural forces now demanding construction at a scale the industry hasn't seen before: data centers, energy infrastructure, civil infrastructure, and defence. And it tracks where capital is flowing, contractor stocks have returned 856.5% since February 2012, against the S&P 500's 554.3% over the same period.
The compressed version of the report is presented below, slide by slide. The full 100+ page report is available for download above.

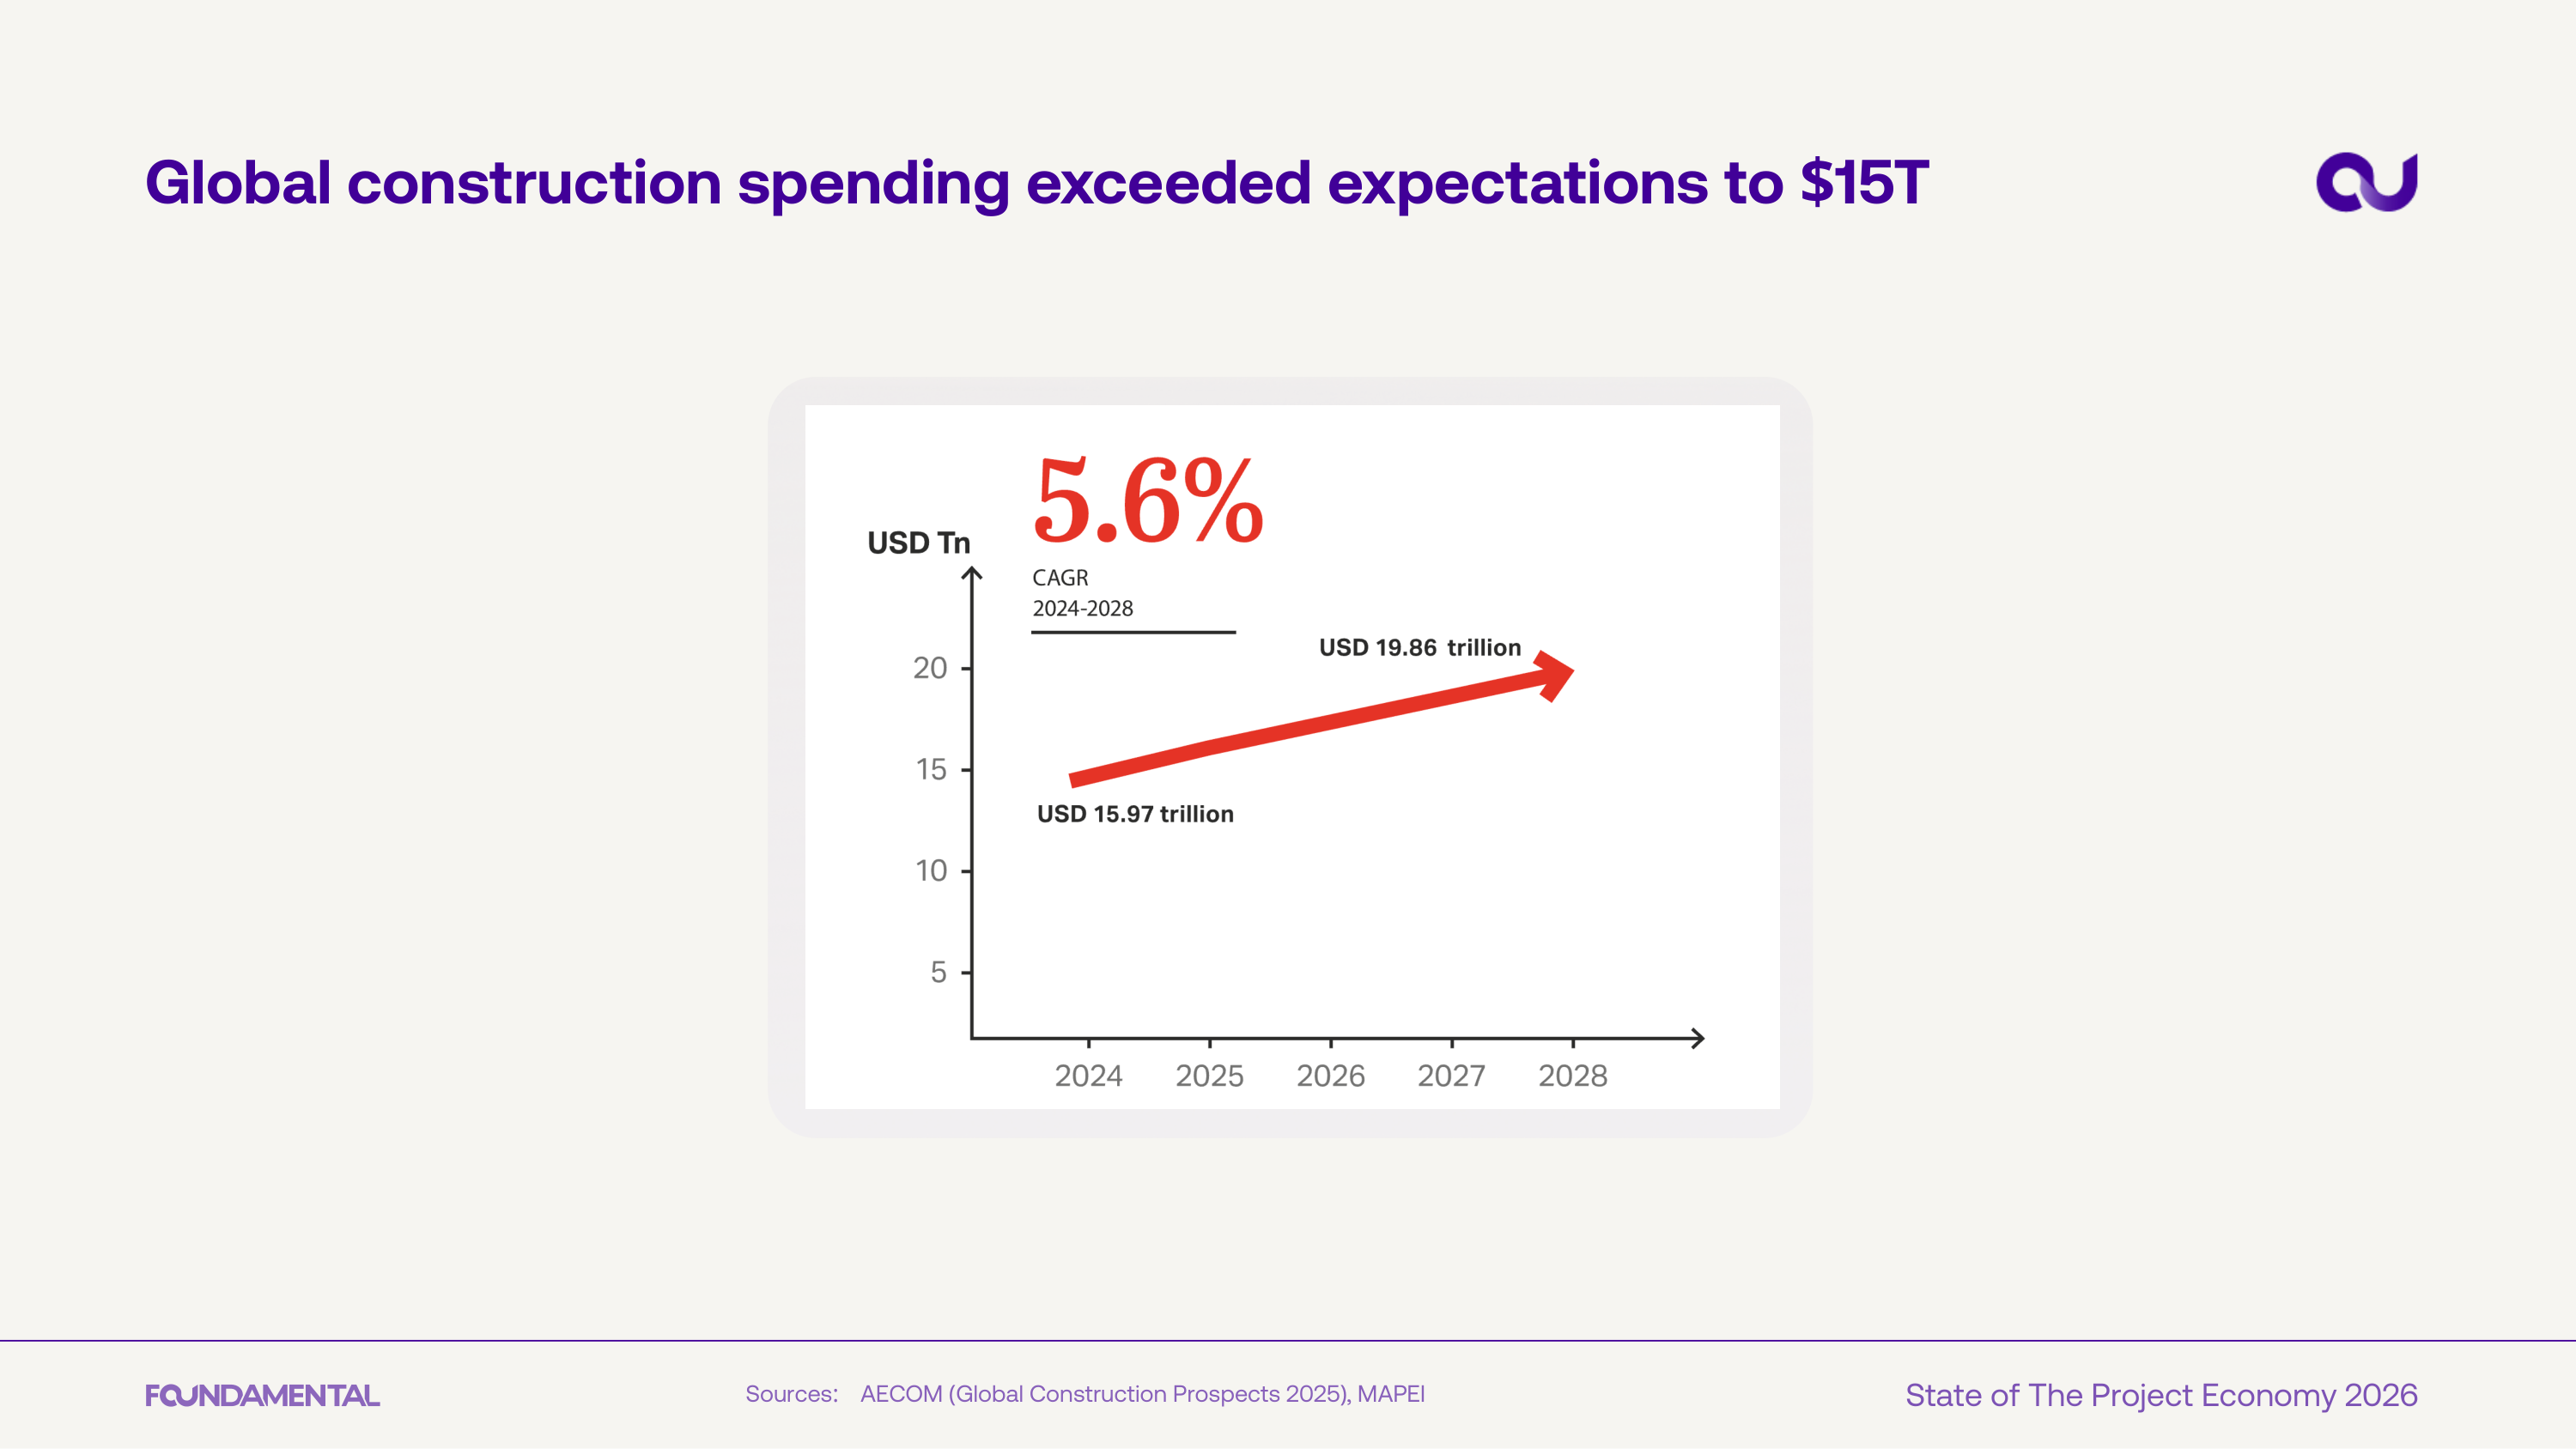
Global construction spending has crossed $15T, with a projected 5.6% CAGR through 2028 that would push the market toward $20T. The scale of this sector continues to surprise to the upside.
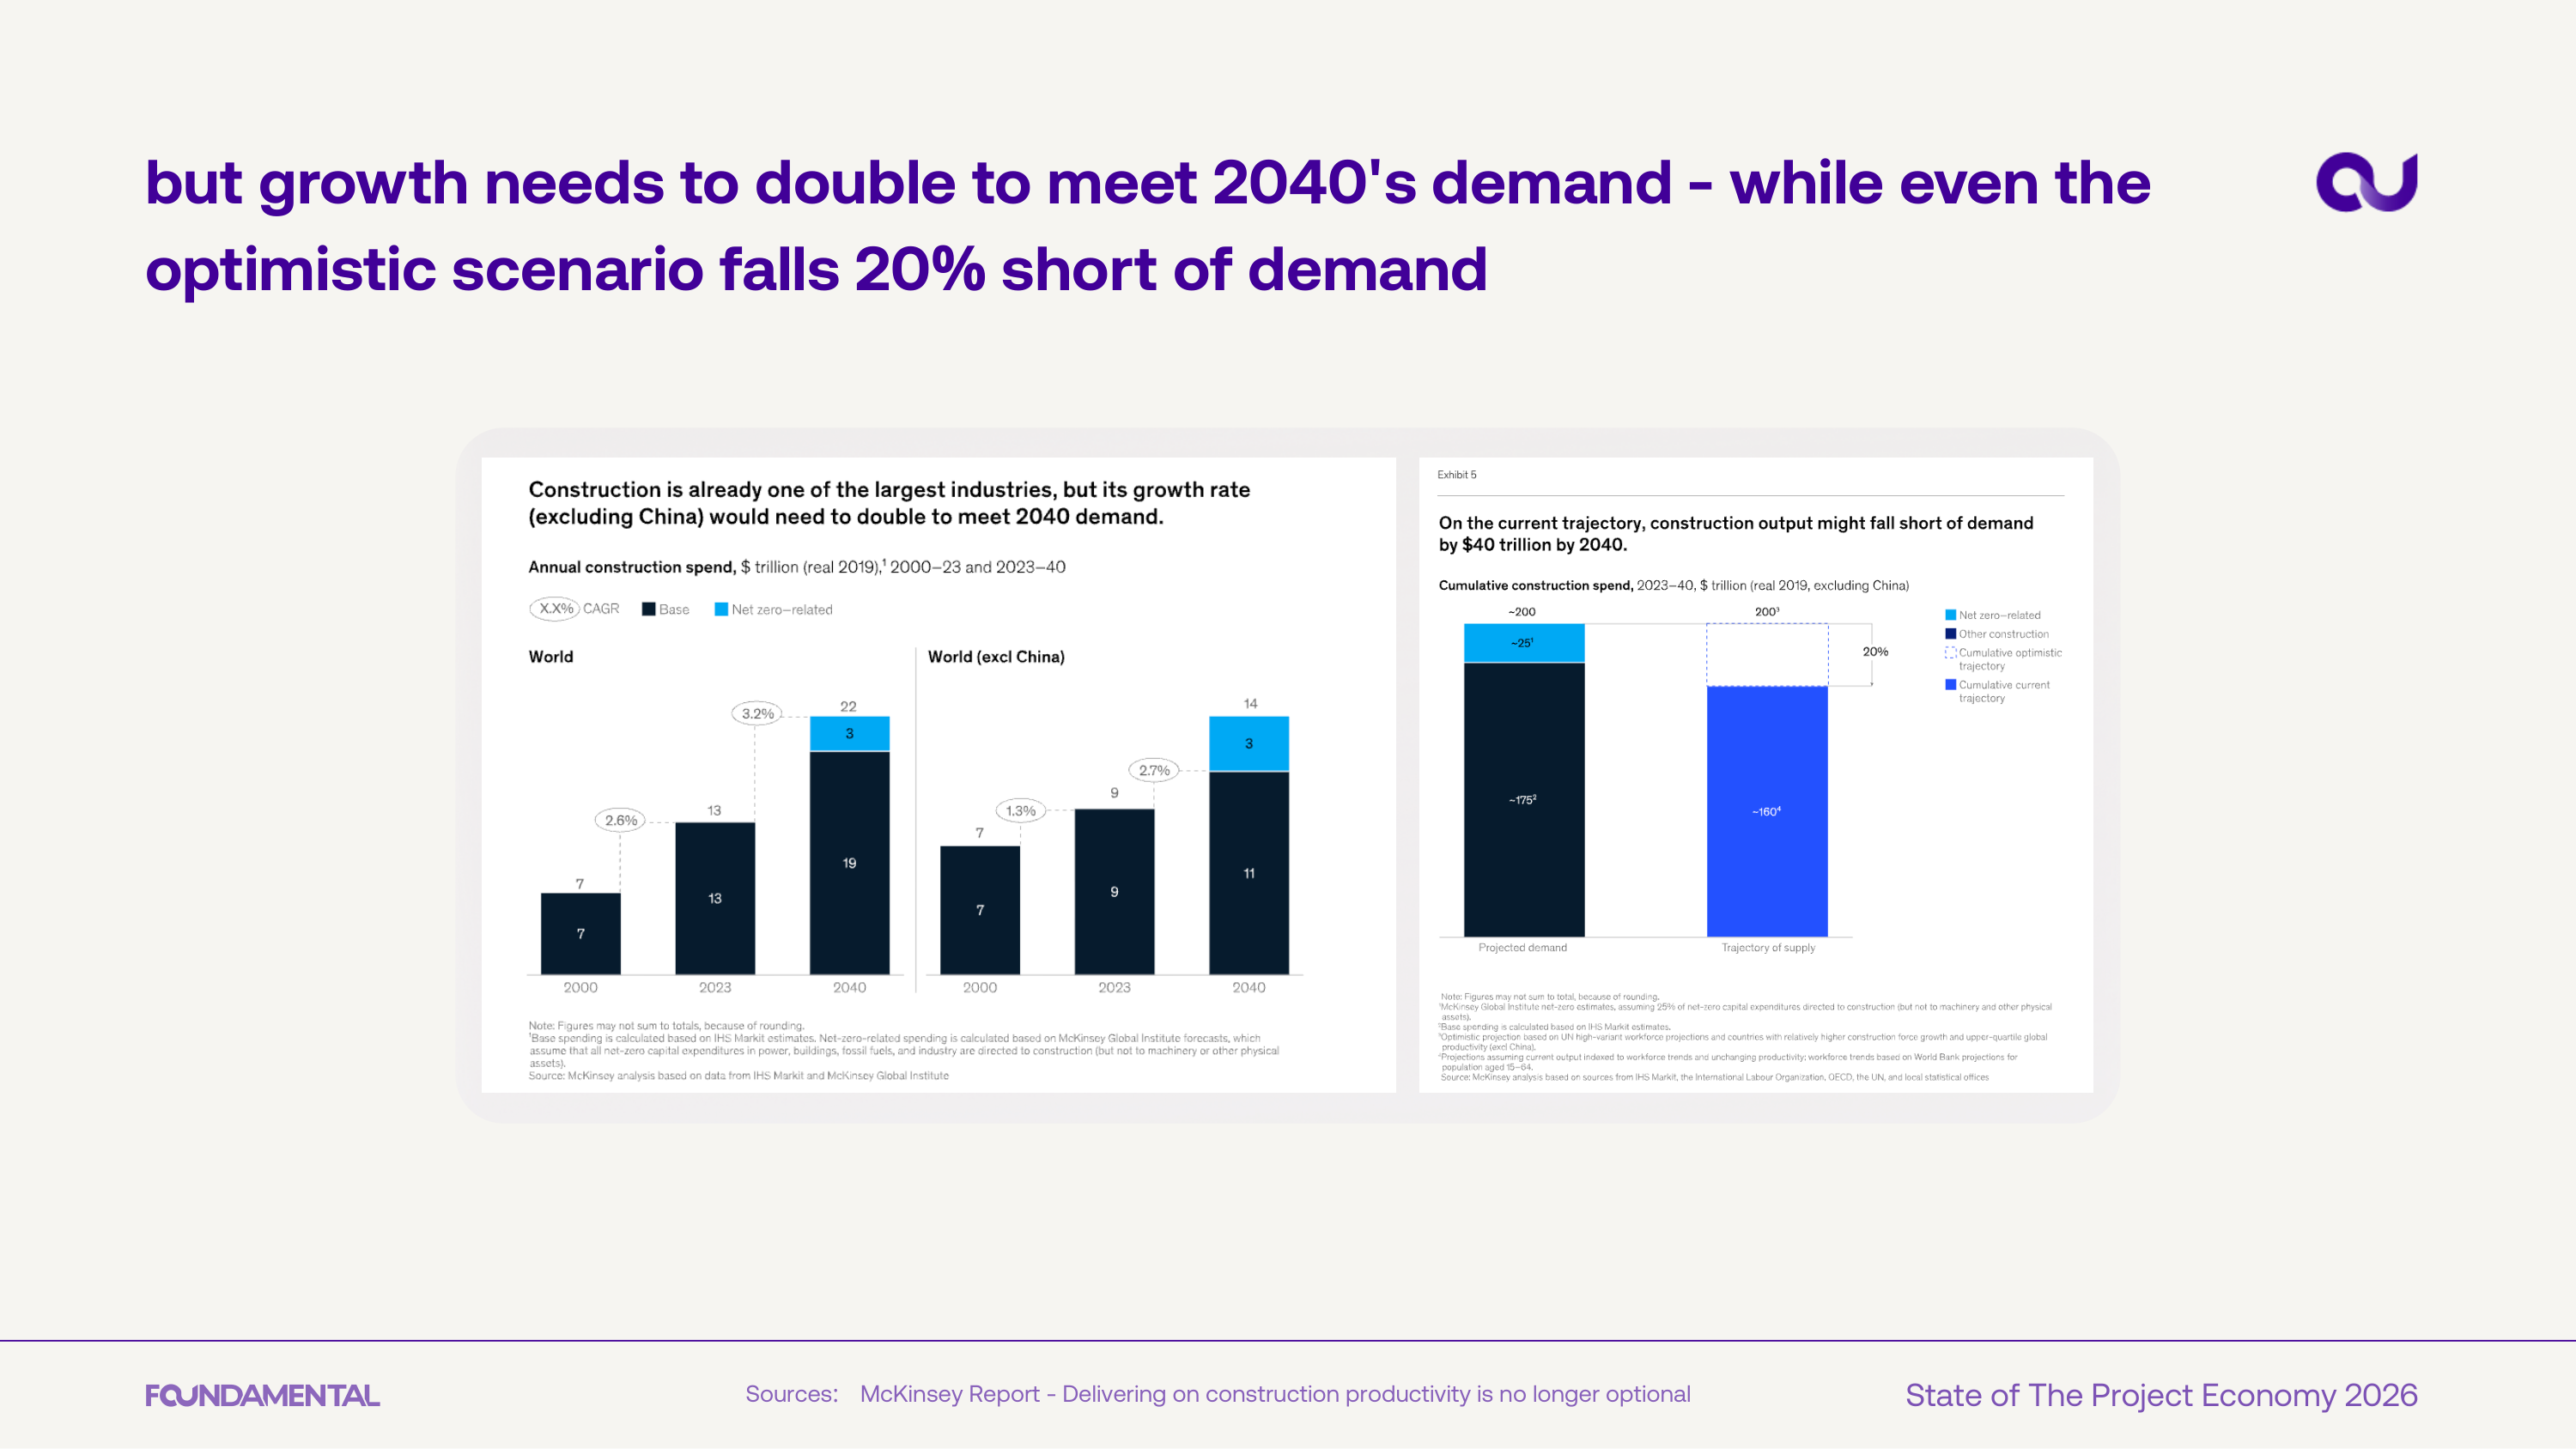
McKinsey data shows construction growth needs to double to meet 2040 demand. Even the optimistic scenario falls 20% short - excluding China, the gap widens further.
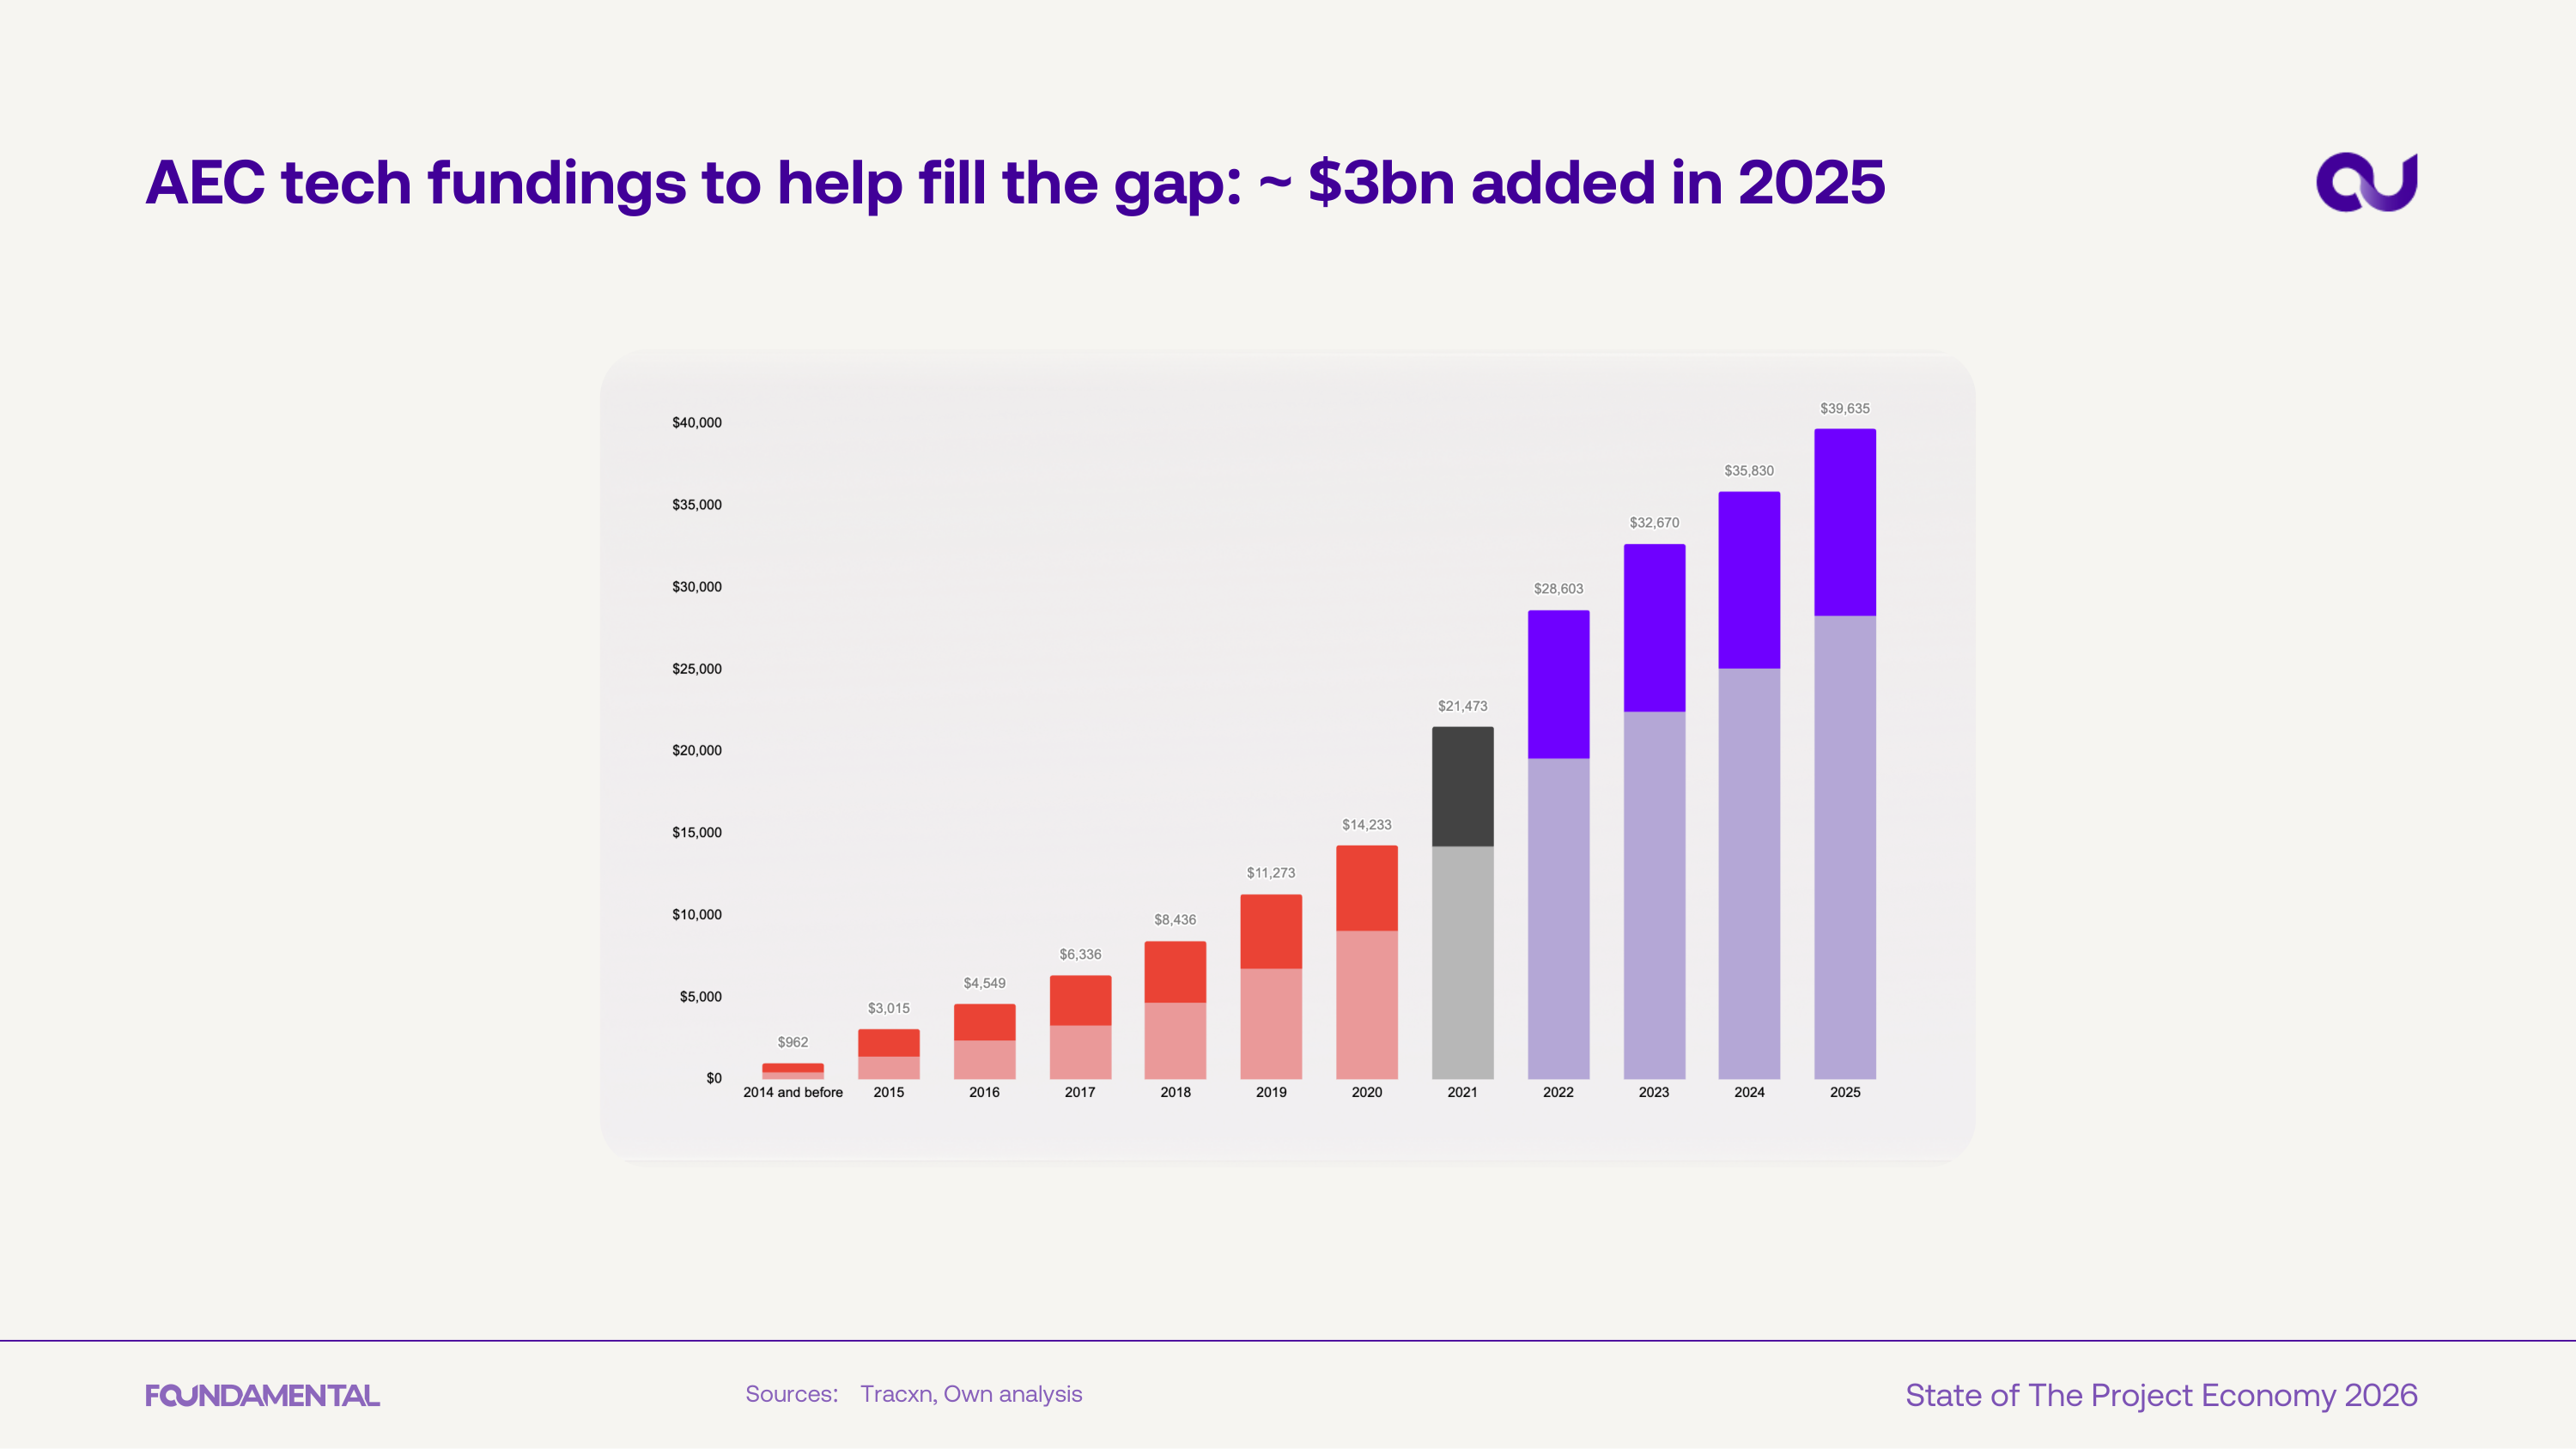
AEC technology funding has grown steadily to roughly $3B in 2025, with cumulative investment now exceeding $36B. The trend reflects sustained investor conviction that the sector needs new technology to close its productivity gap.
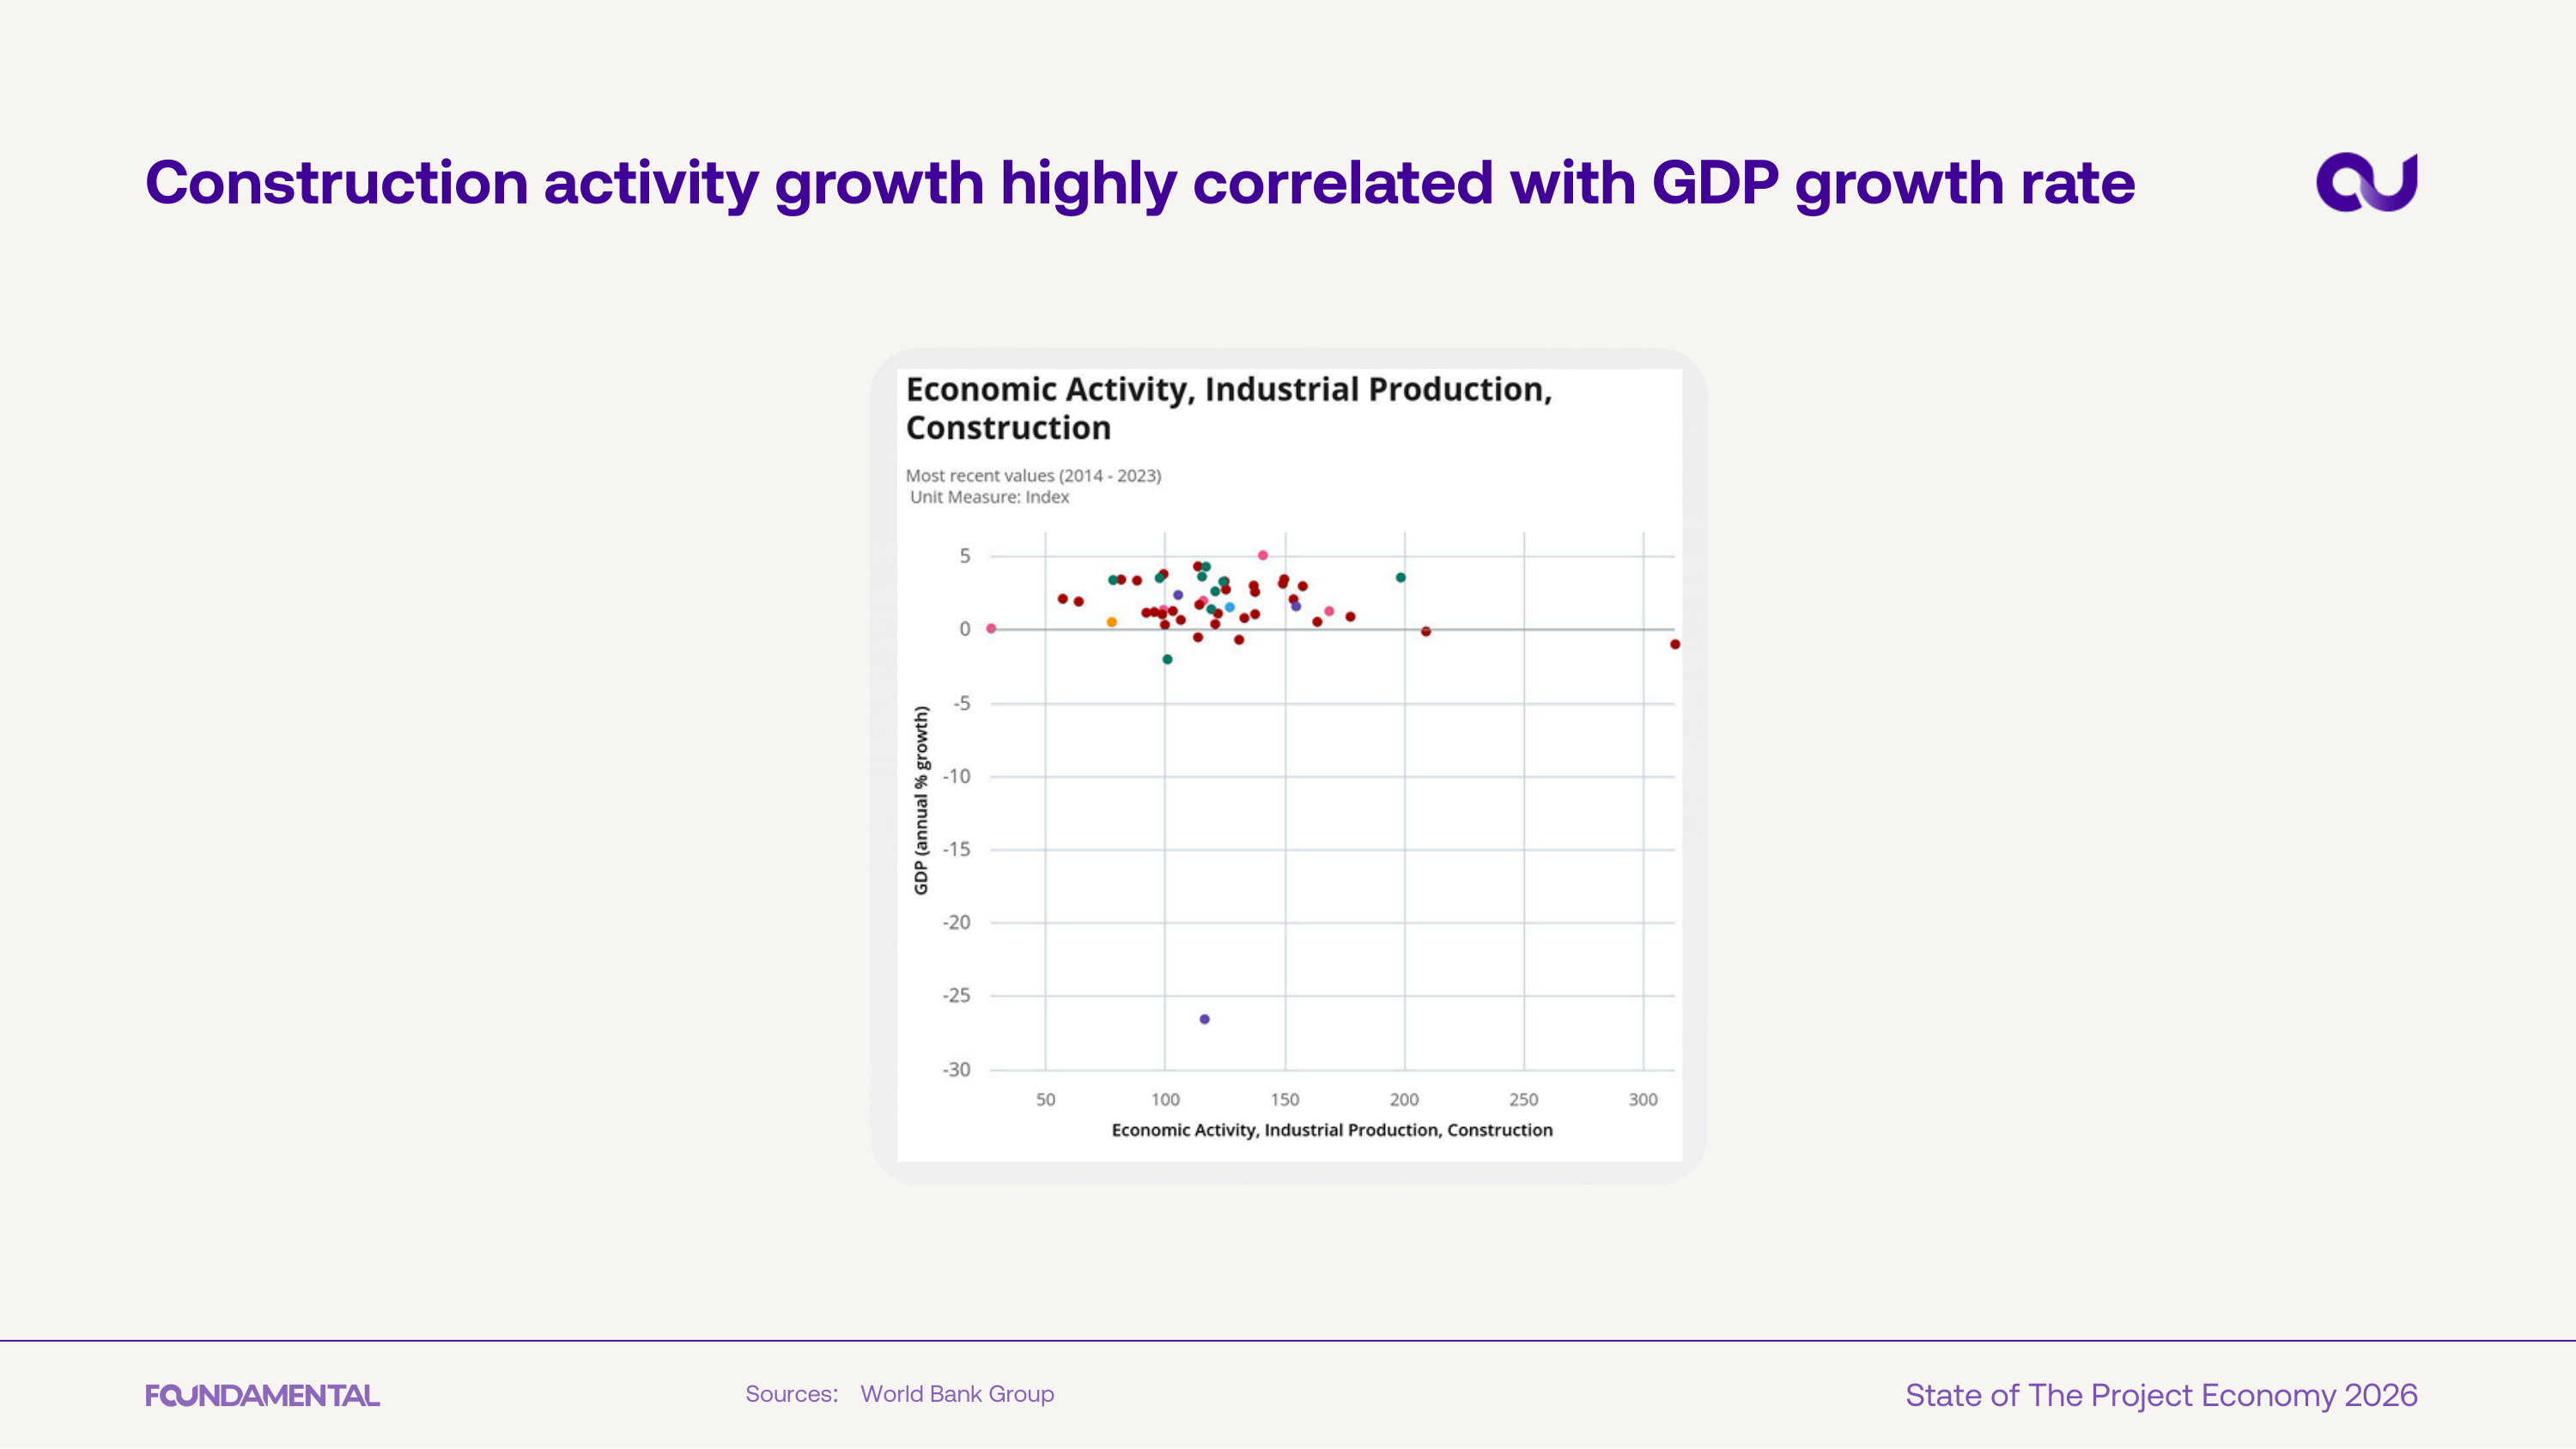
A World Bank scatter plot shows construction activity tracks GDP growth closely. The tight correlation underscores construction as both a driver and barometer of broader economic health.
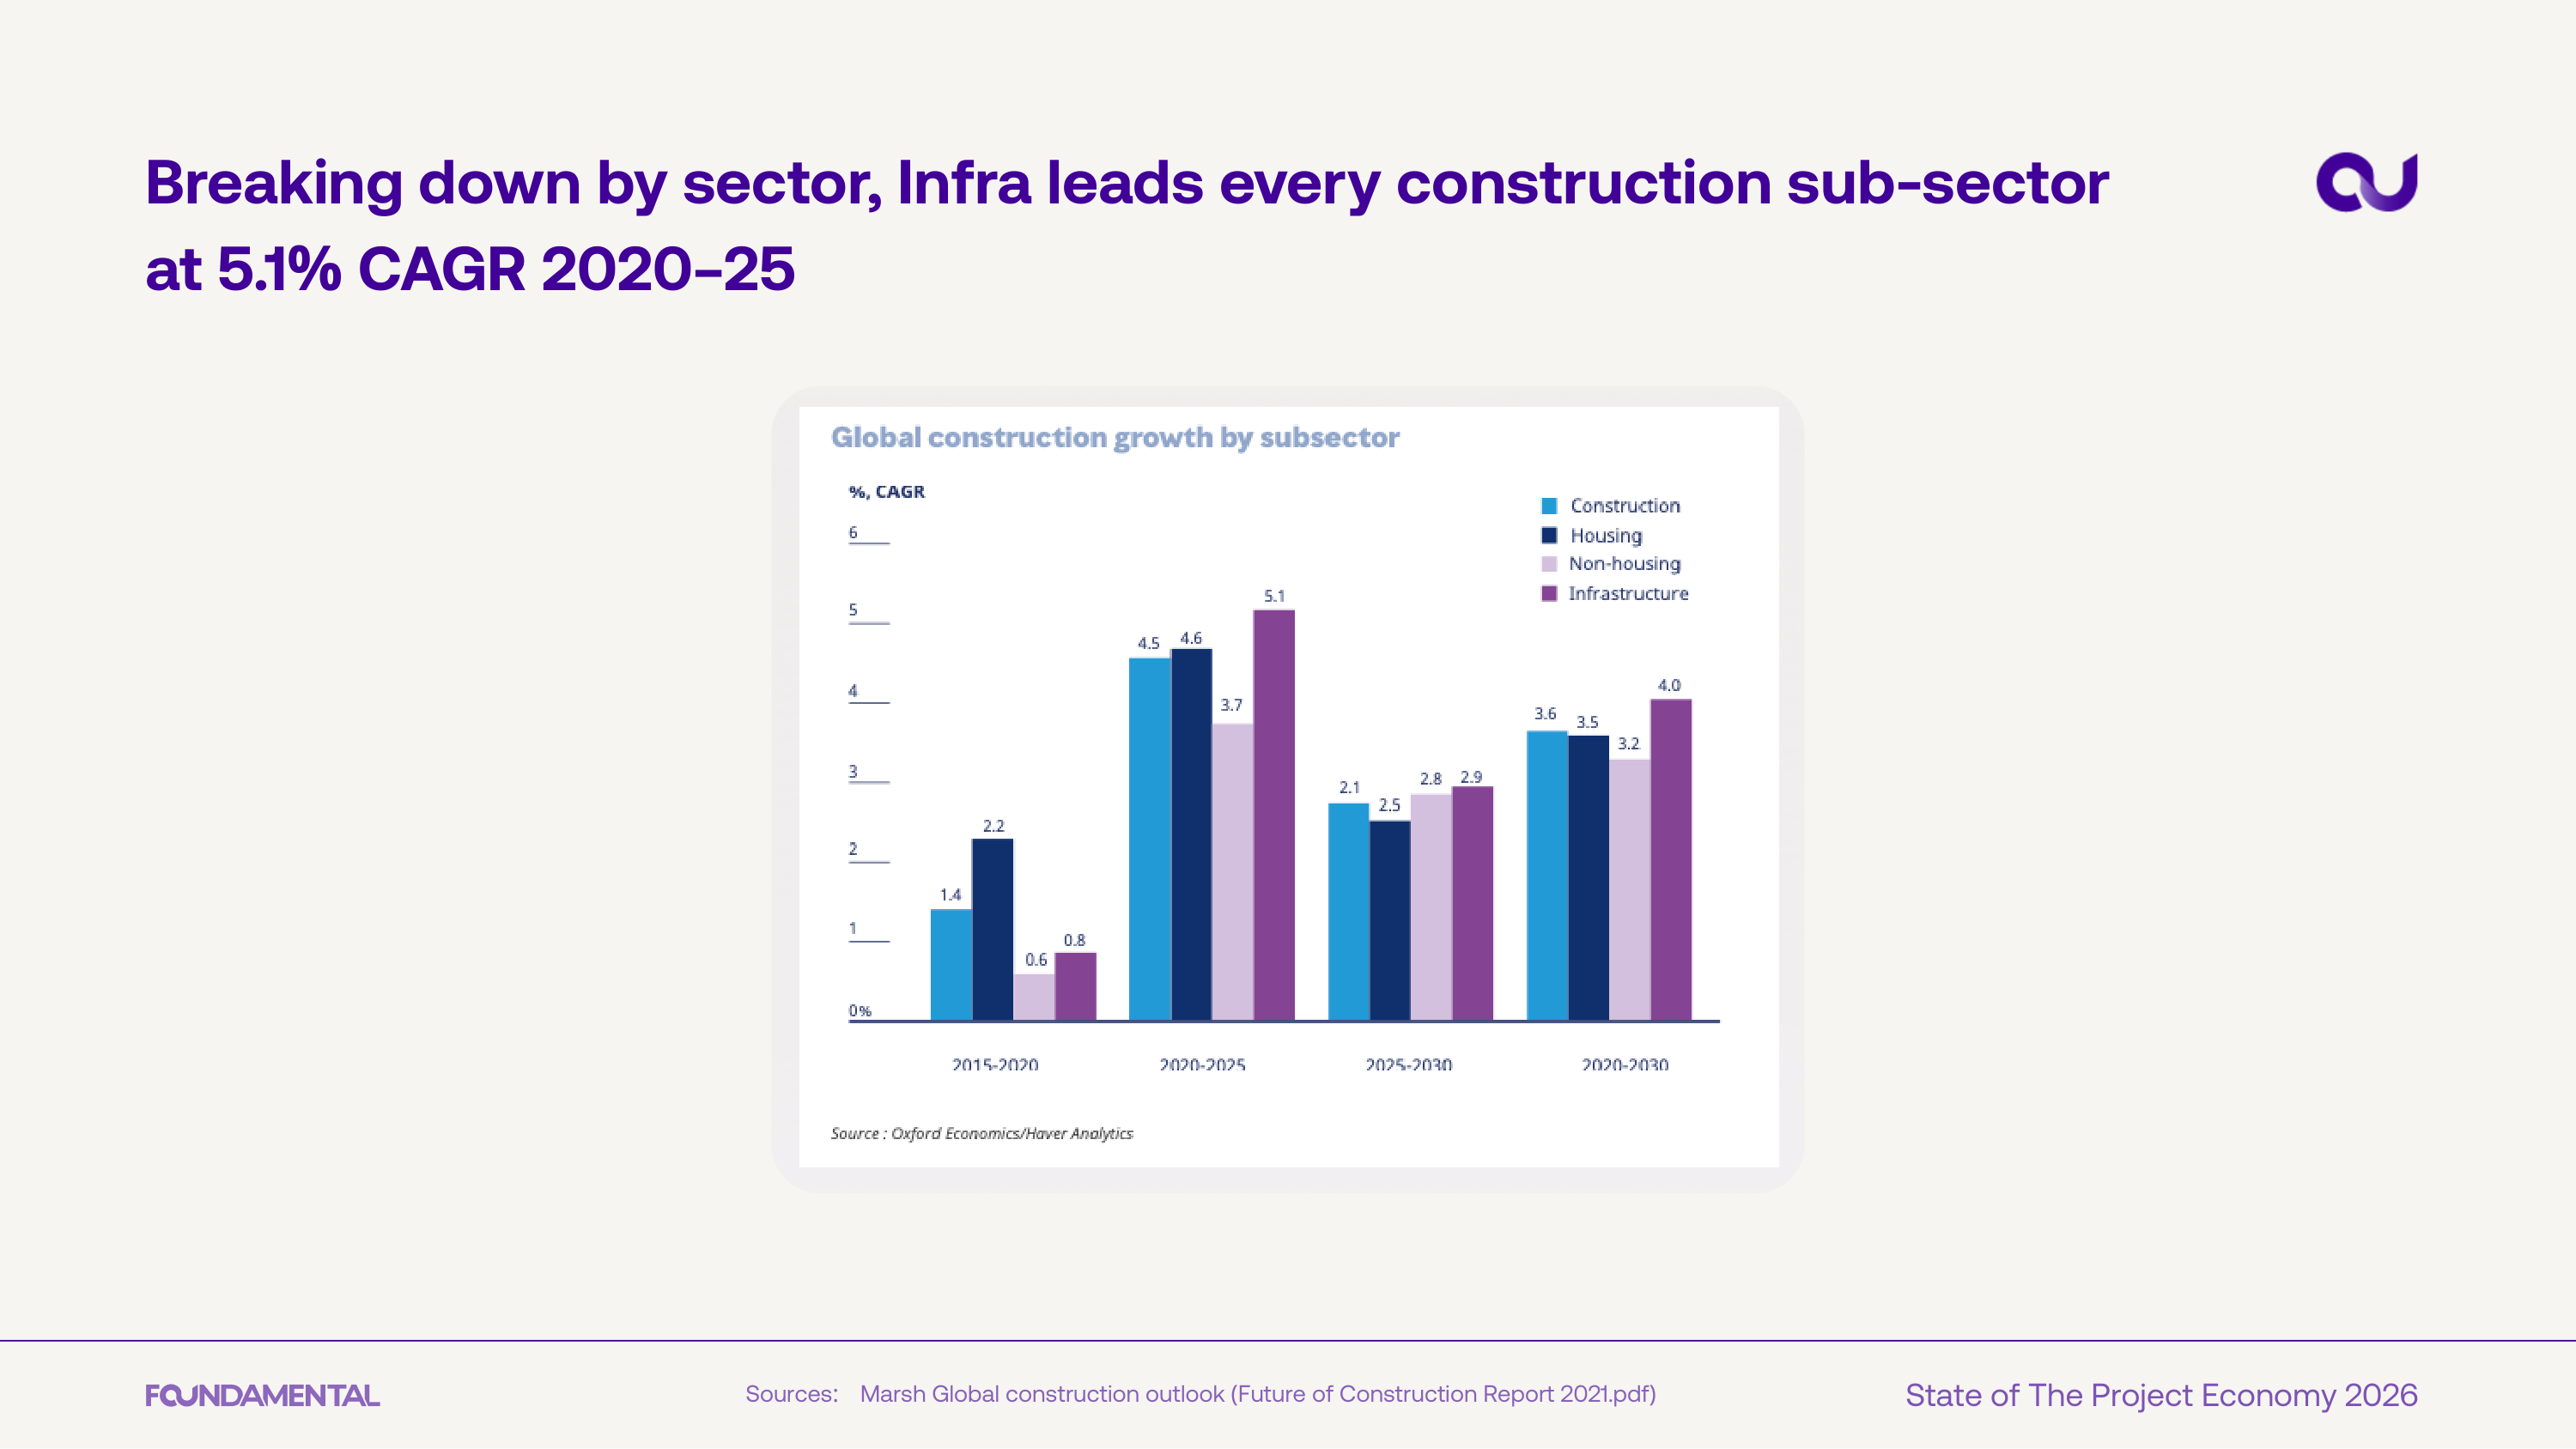
Infrastructure outpaces every other construction subsector at 5.1% CAGR from 2020-2025, driven by government stimulus and energy transition programs. Housing and non-housing construction trail behind, signaling where capital is concentrating.
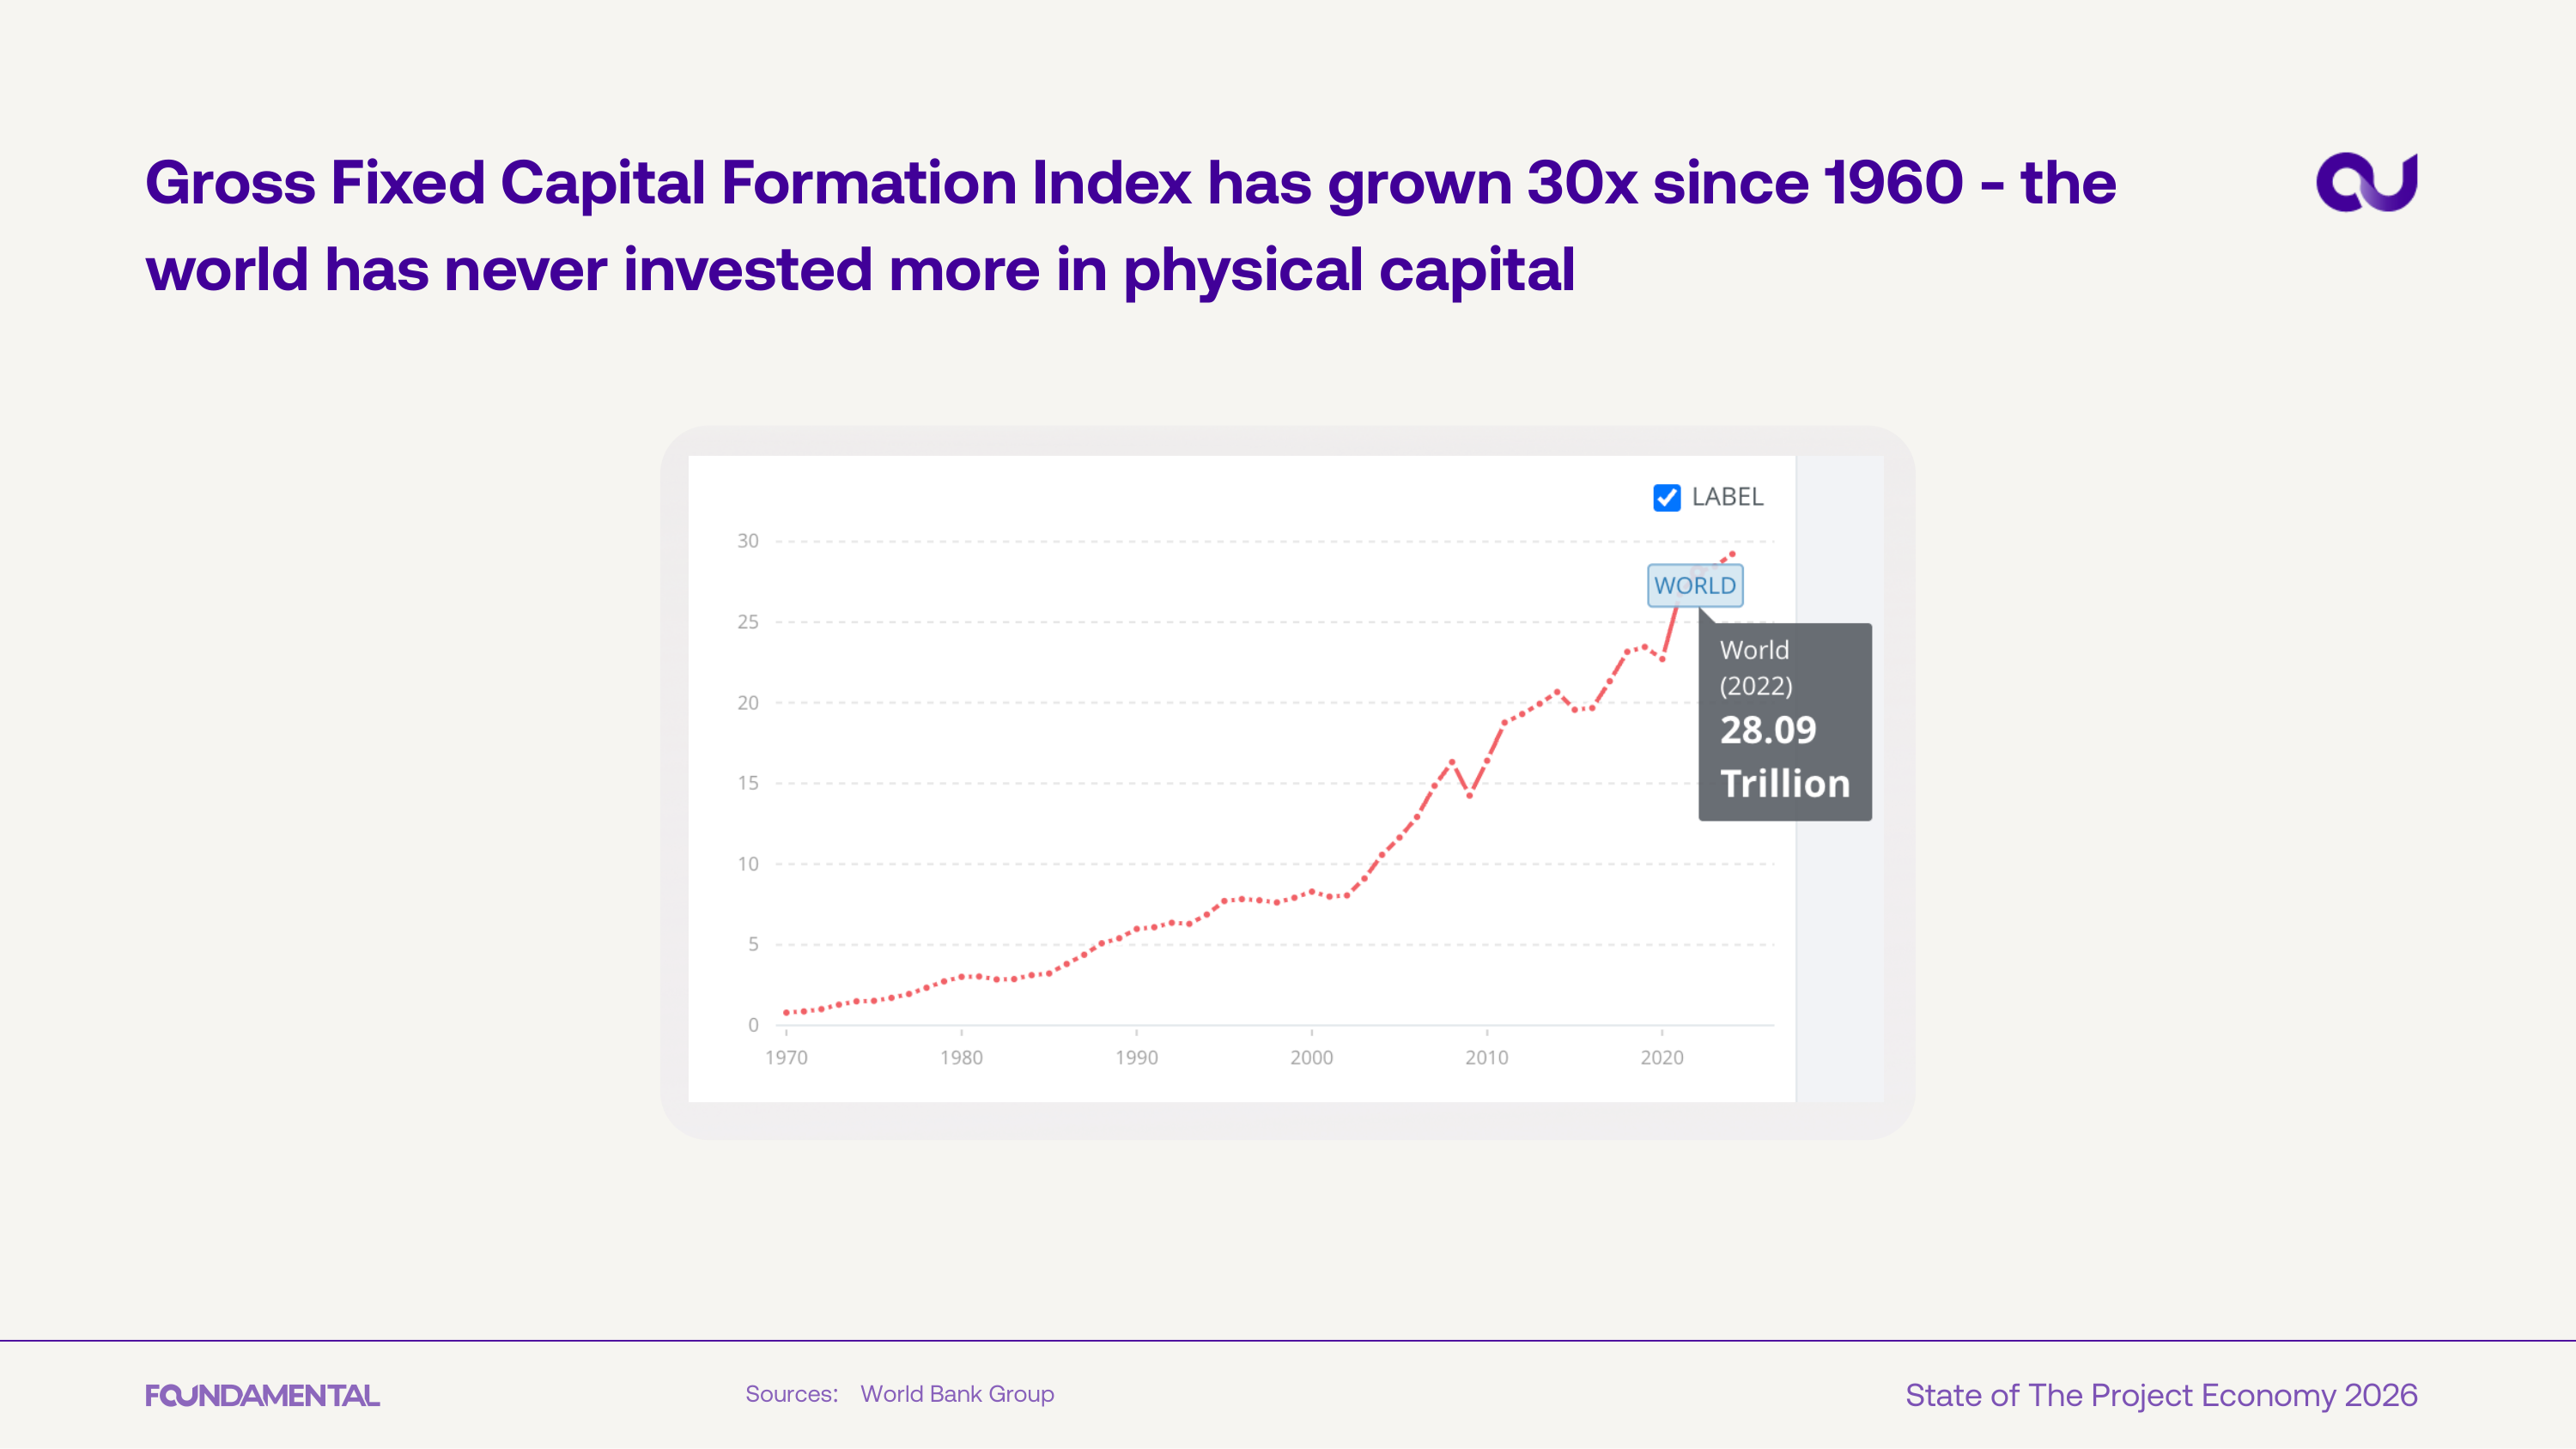
The Gross Fixed Capital Formation Index has grown 30x since 1960, reaching $28.09T globally in 2022. The world has never invested more in physical capital - and the curve is steepening.
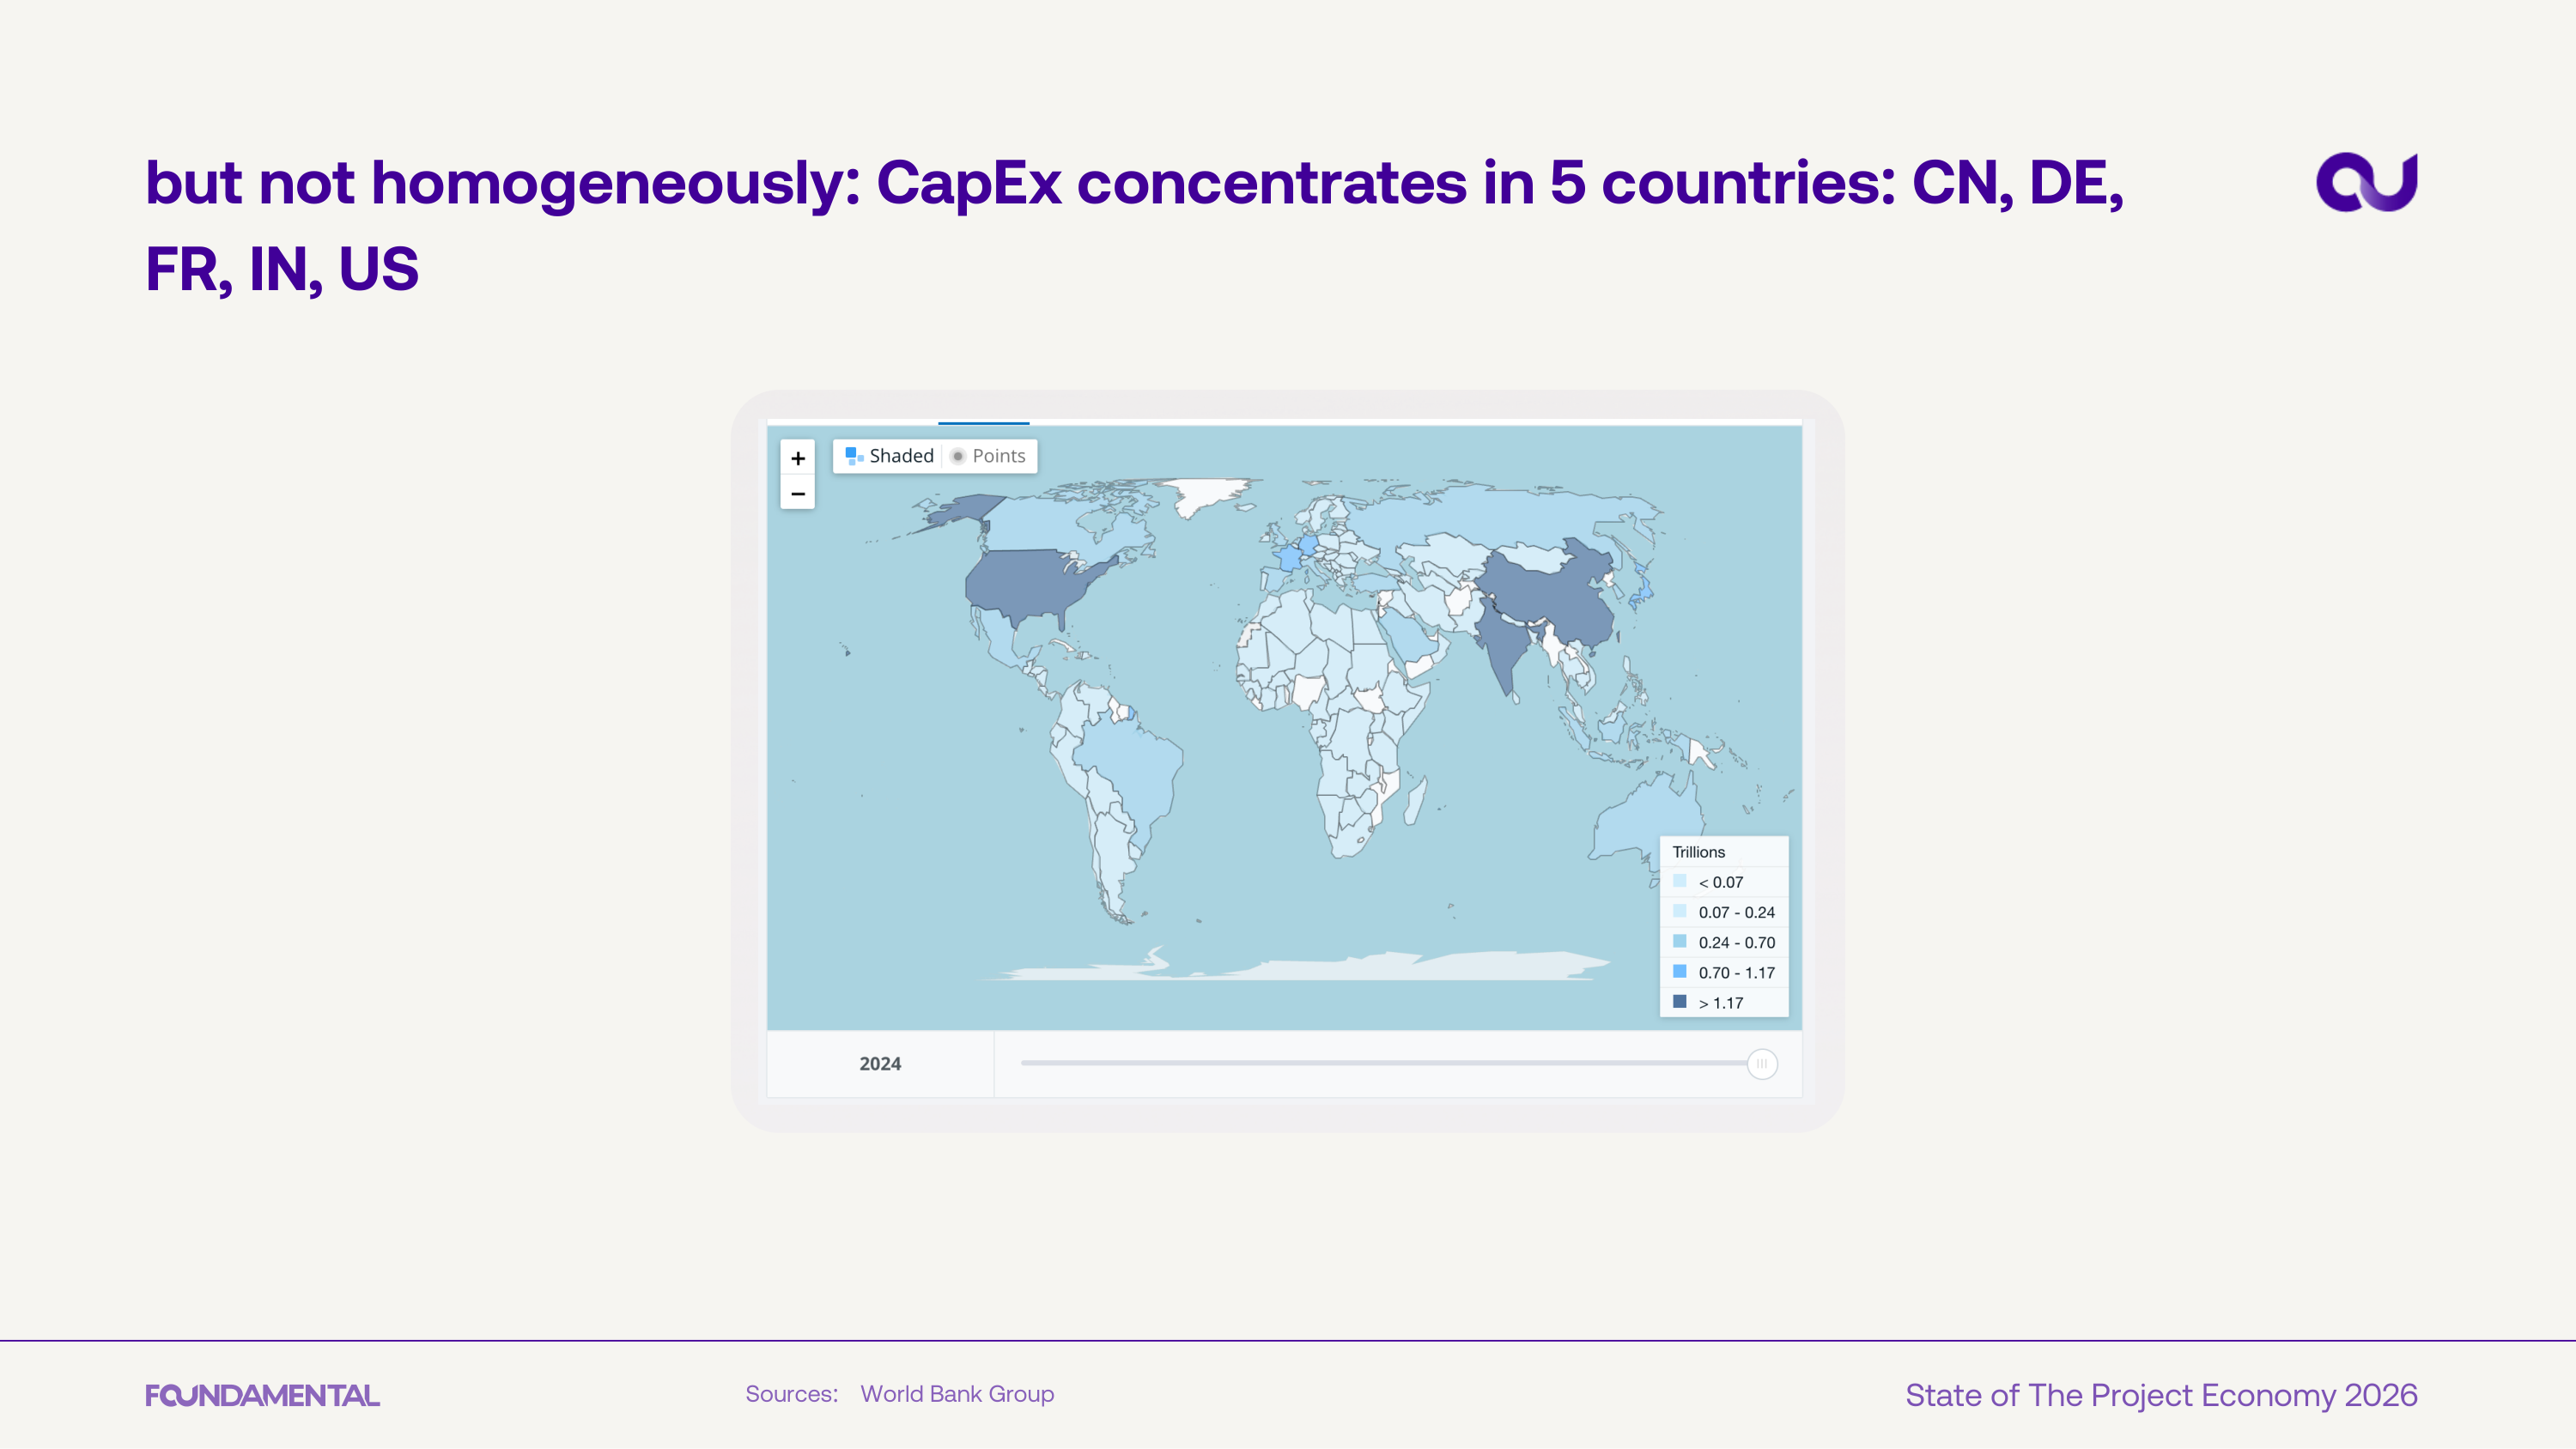
Capital expenditure concentrates in just five countries: China, Germany, France, India, and the US. The heat map shows vast regions with near-zero investment in built infrastructure.
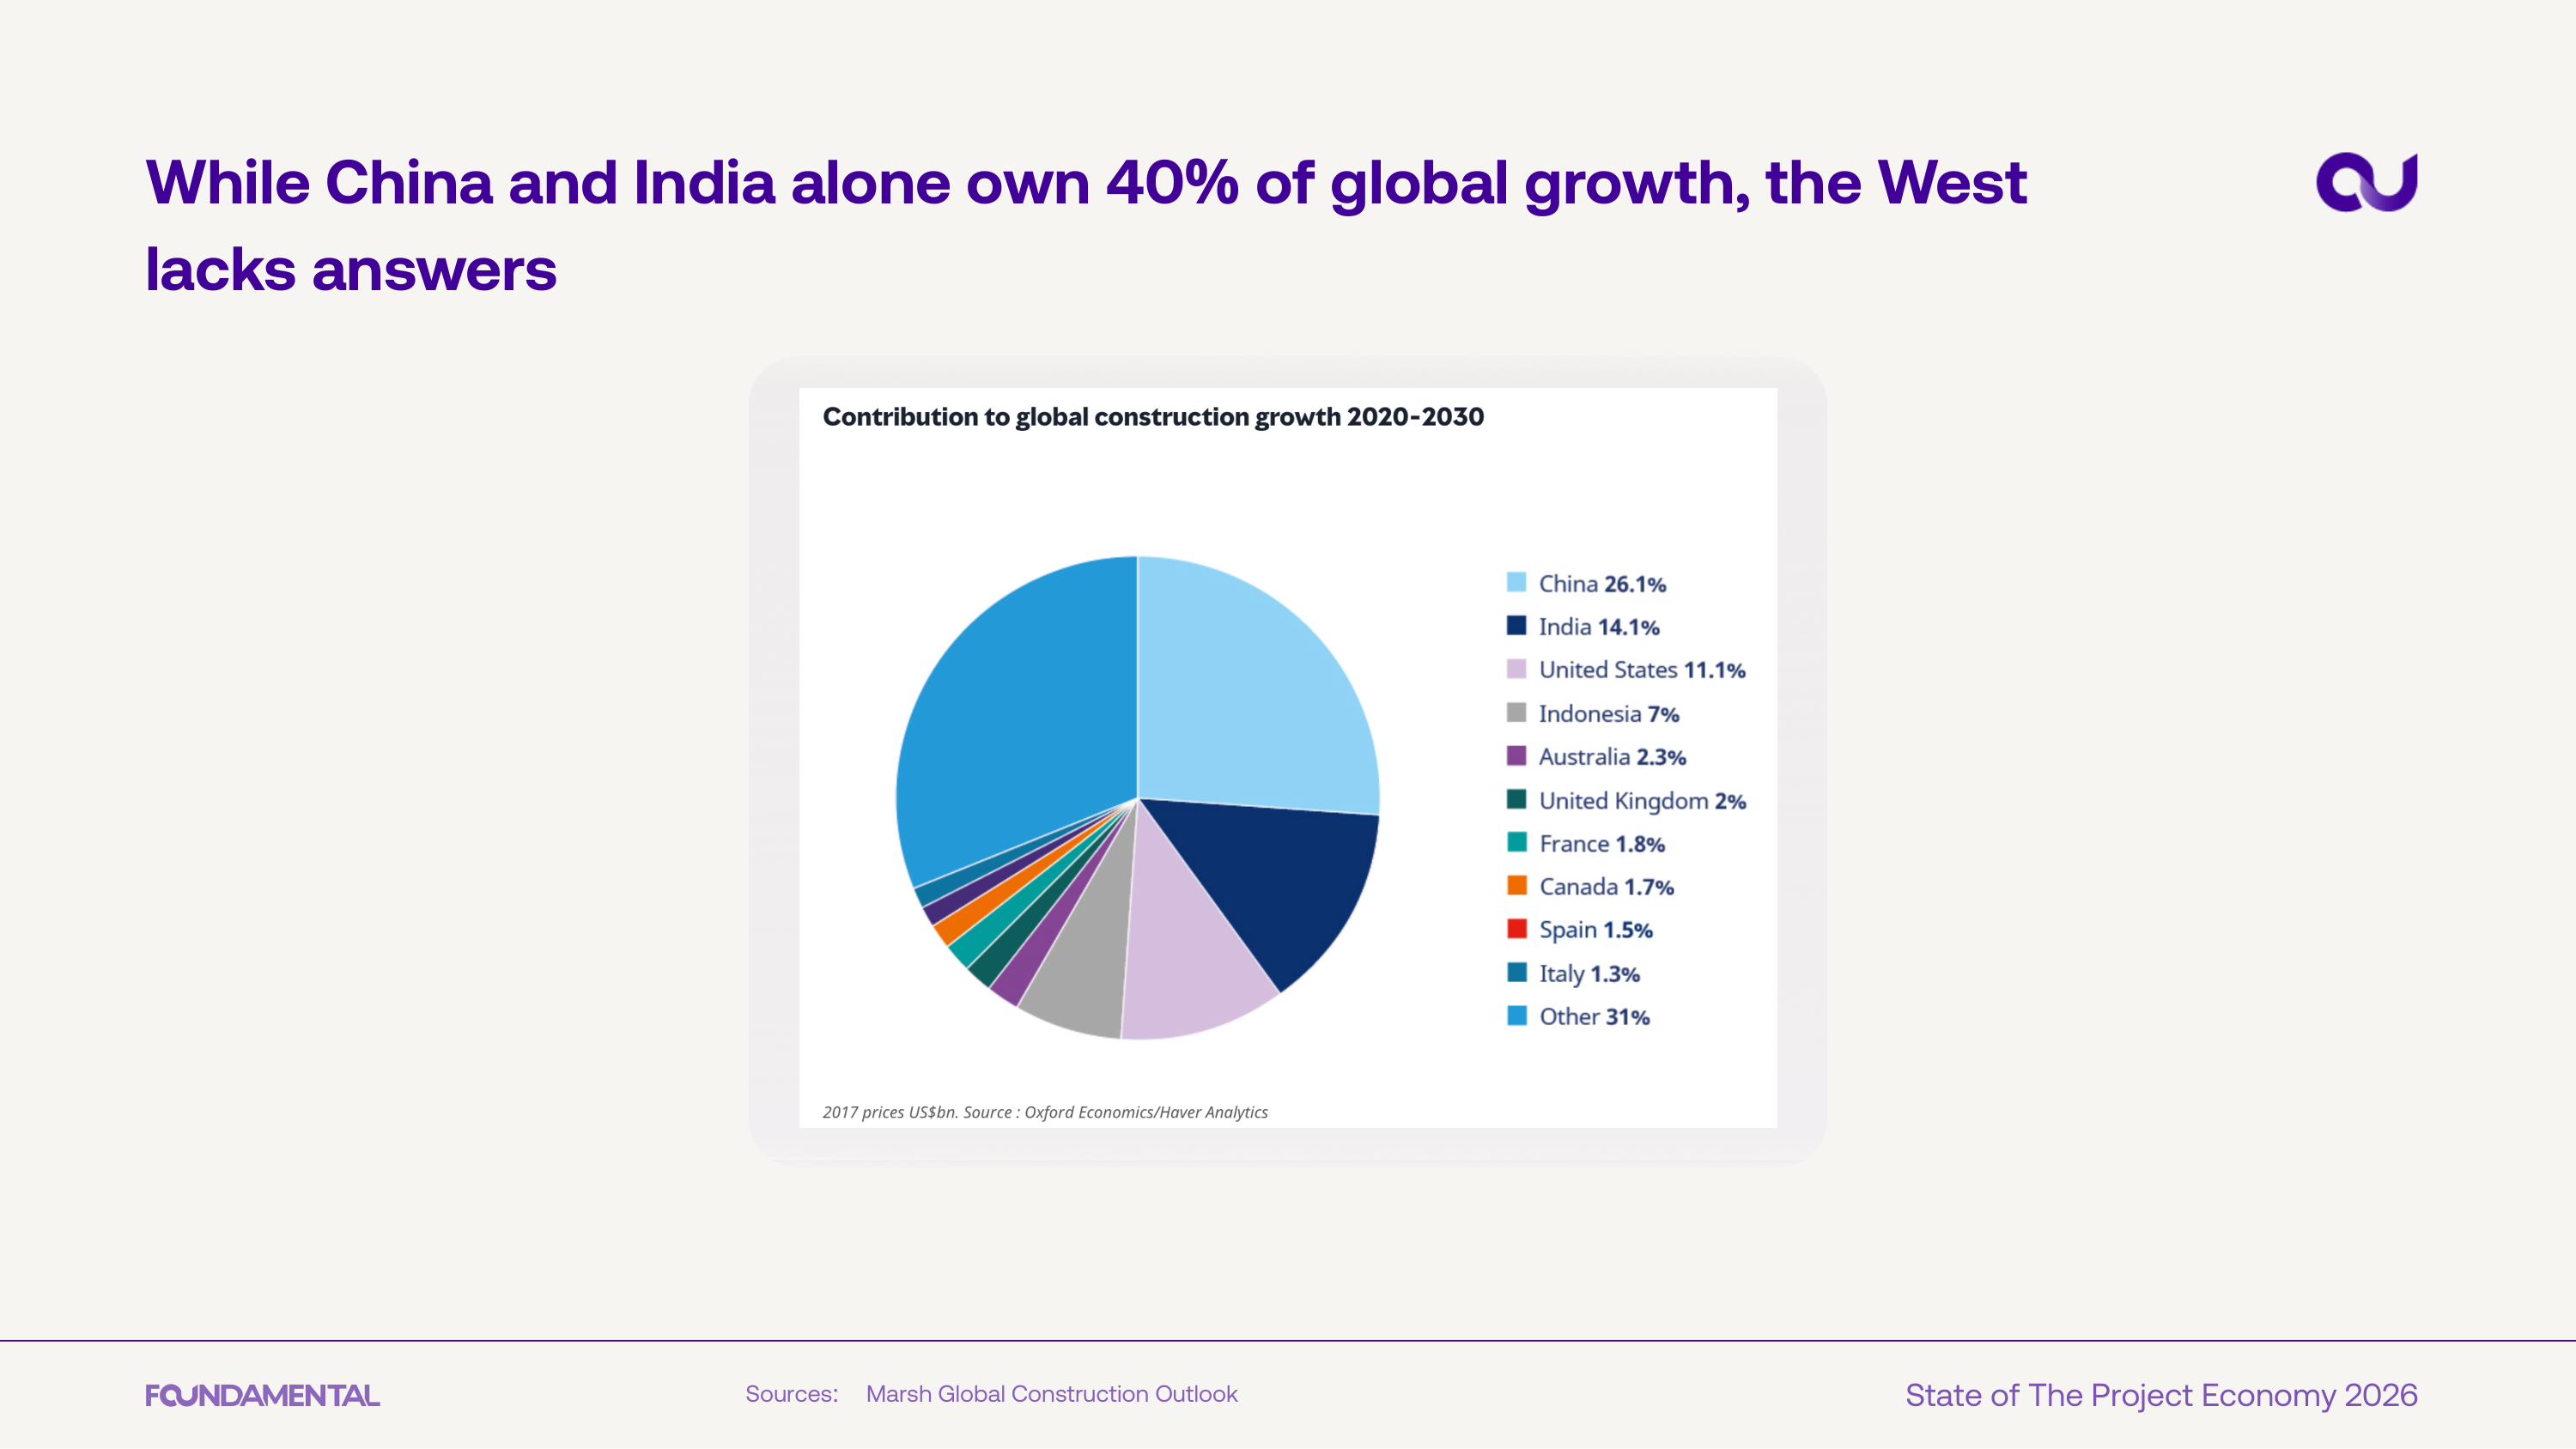
China (26.1%) and India (14.1%) together account for 40% of projected global construction growth through 2030. The US follows at 11.1%, while most Western economies contribute single-digit shares.
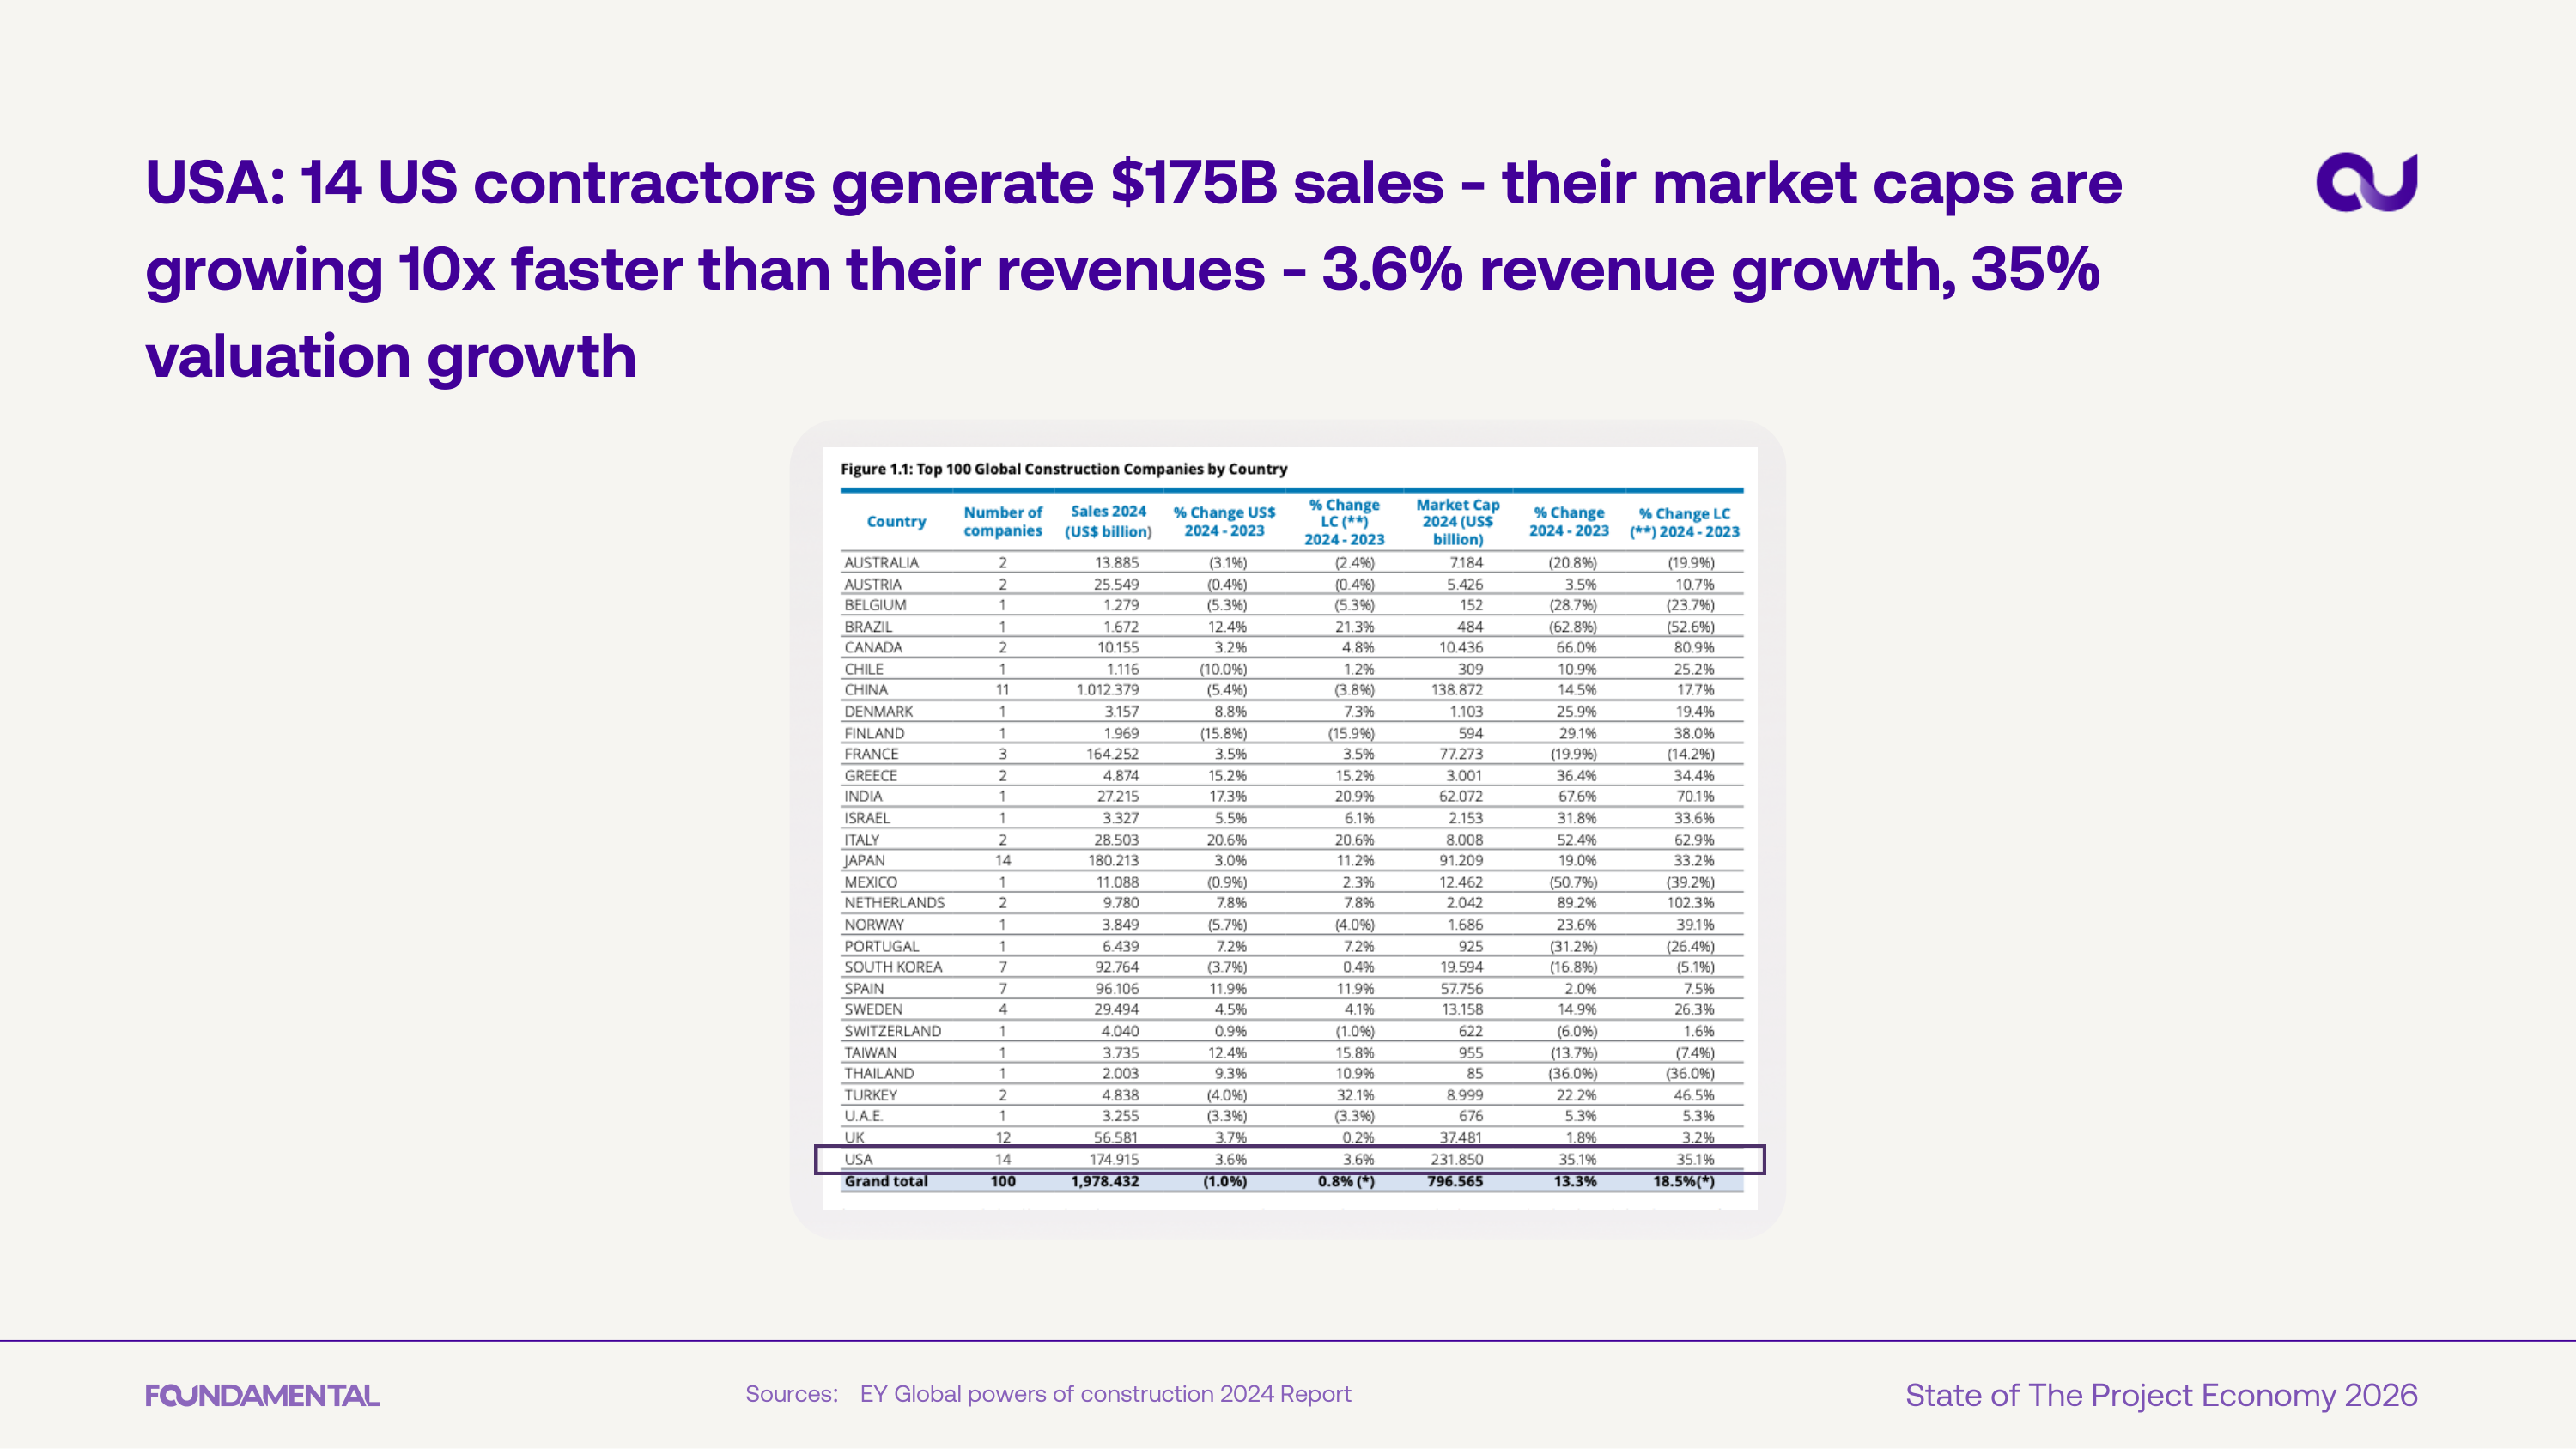
Fourteen US contractors generate $175B in combined sales, but the real story is the disconnect: market capitalizations are growing at 35% while revenues grow at just 3.6%. Investors are pricing in productivity gains that the industry hasn't yet delivered.
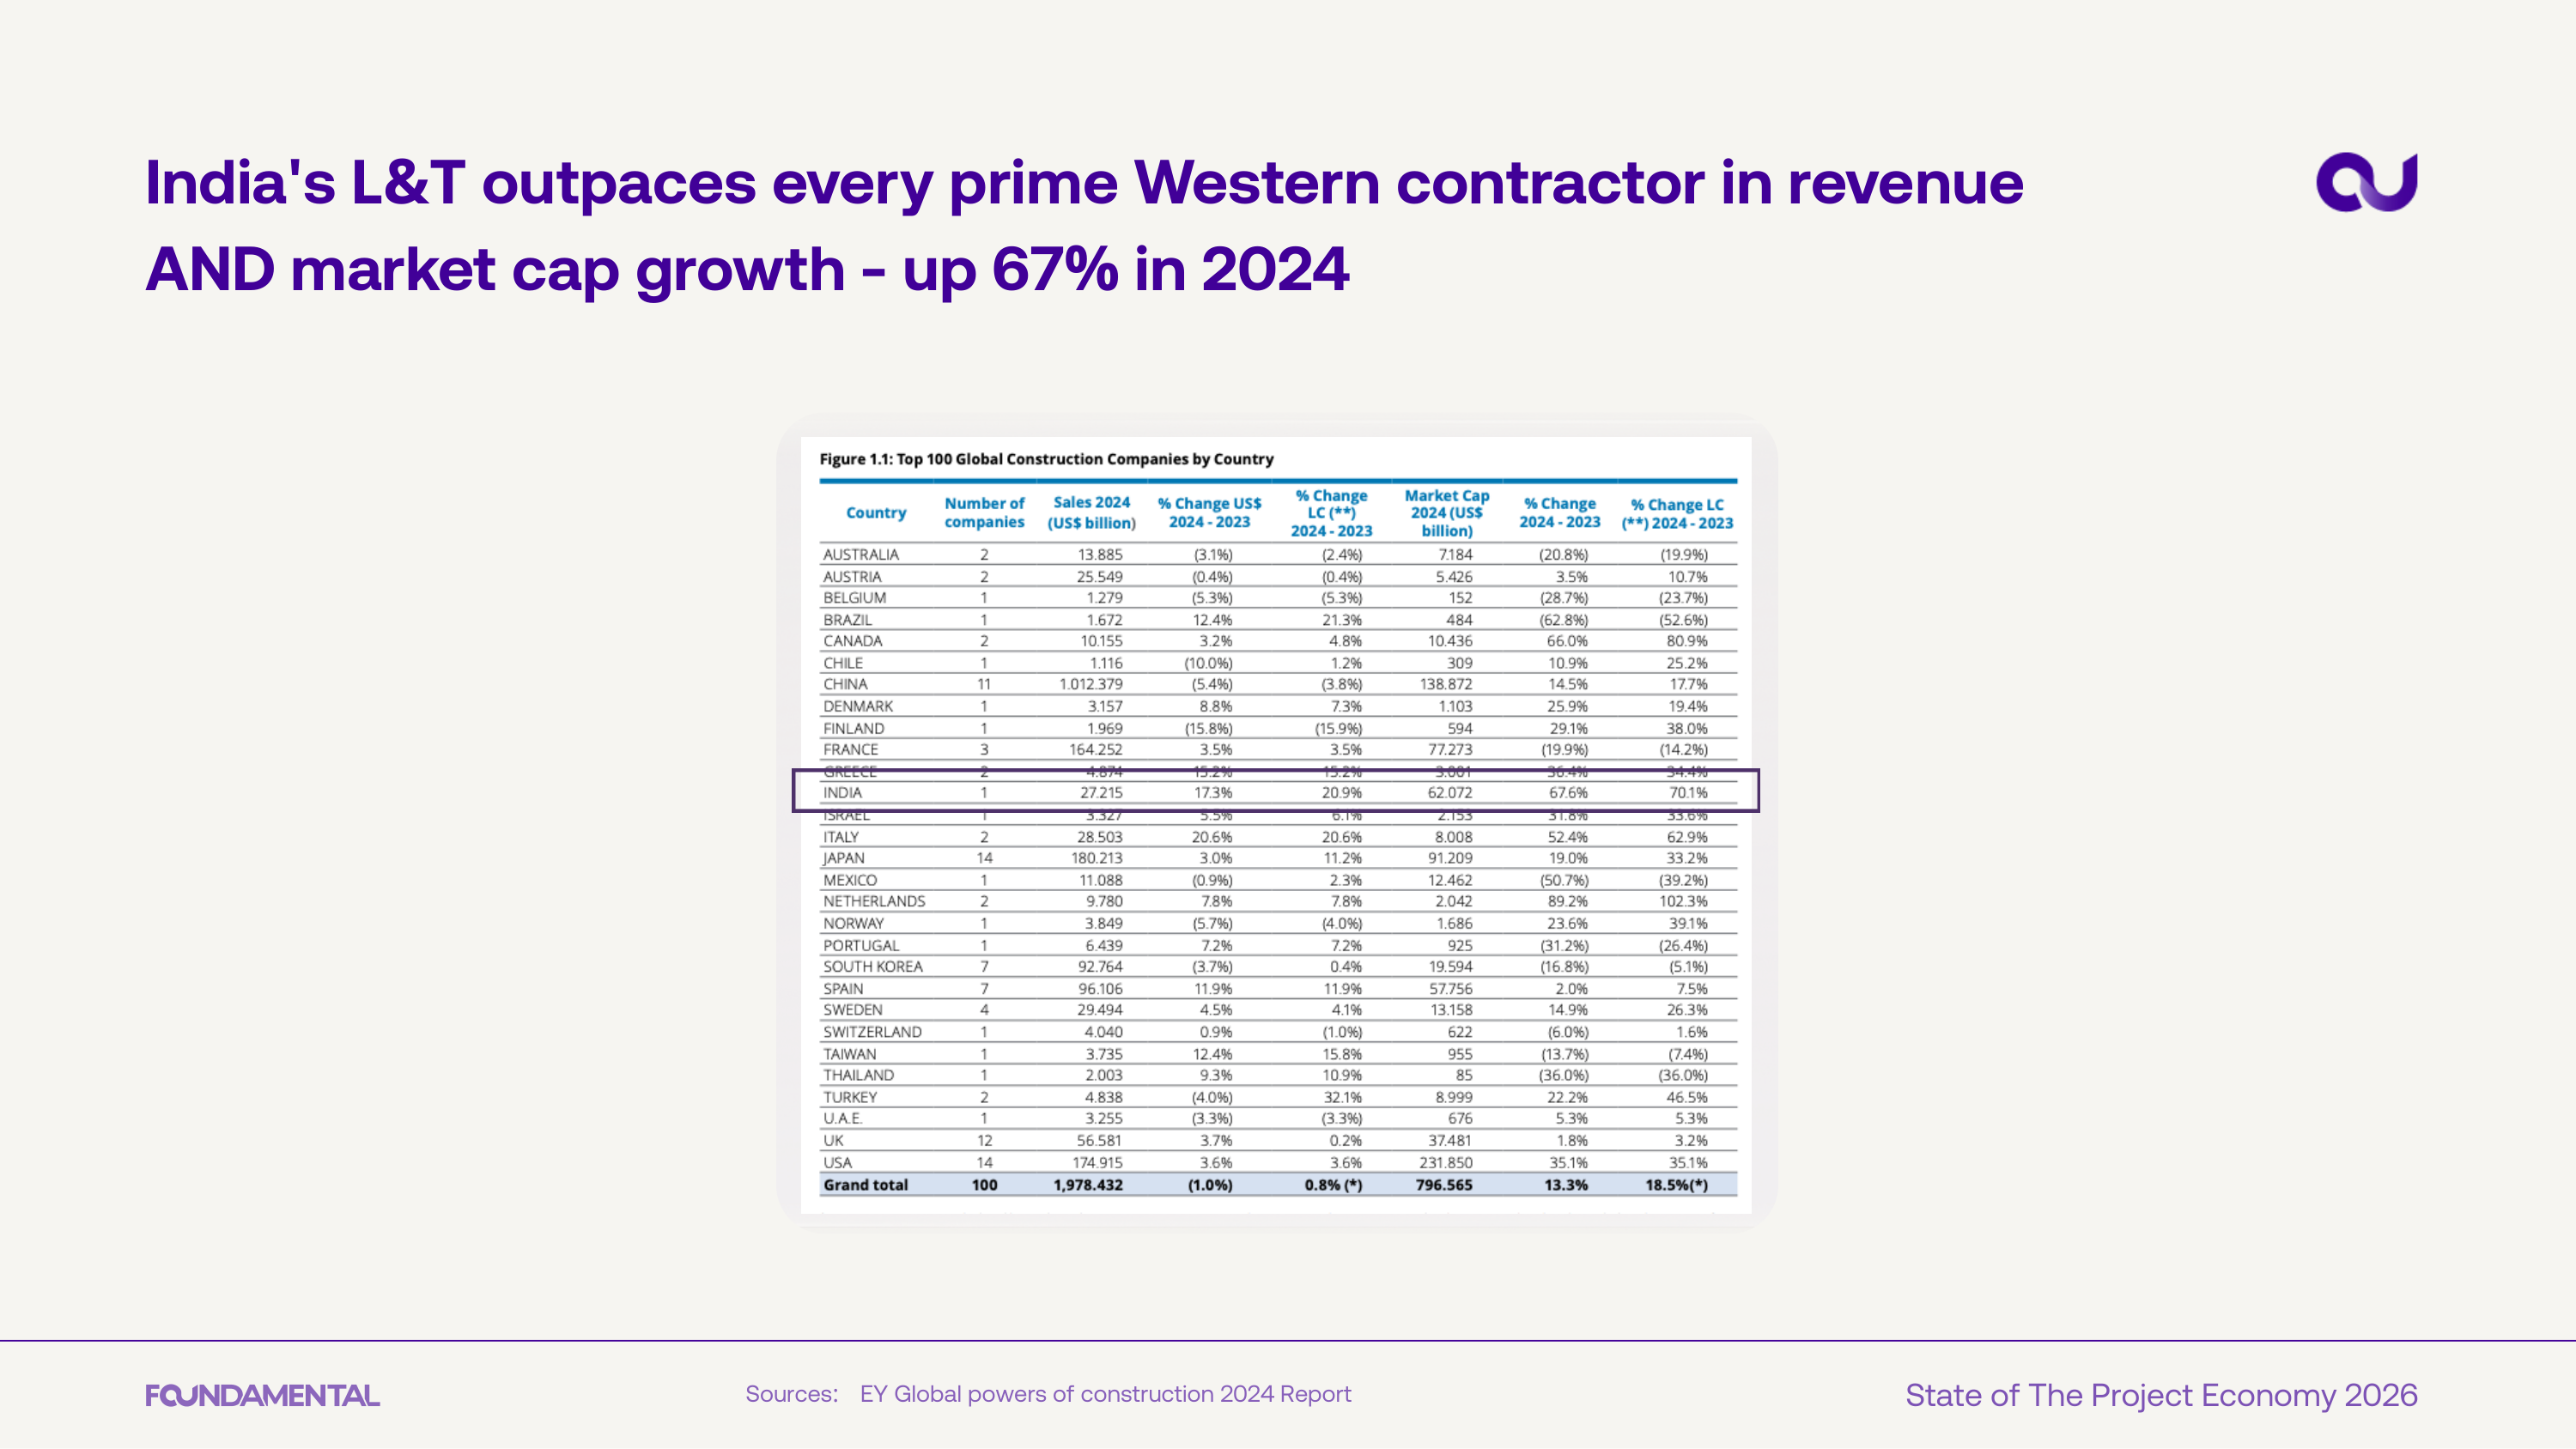
India's Larsen & Toubro outpaces every major Western contractor in both revenue and market cap growth, with valuations up 67% in 2024. The data signals where the next generation of construction giants is emerging.
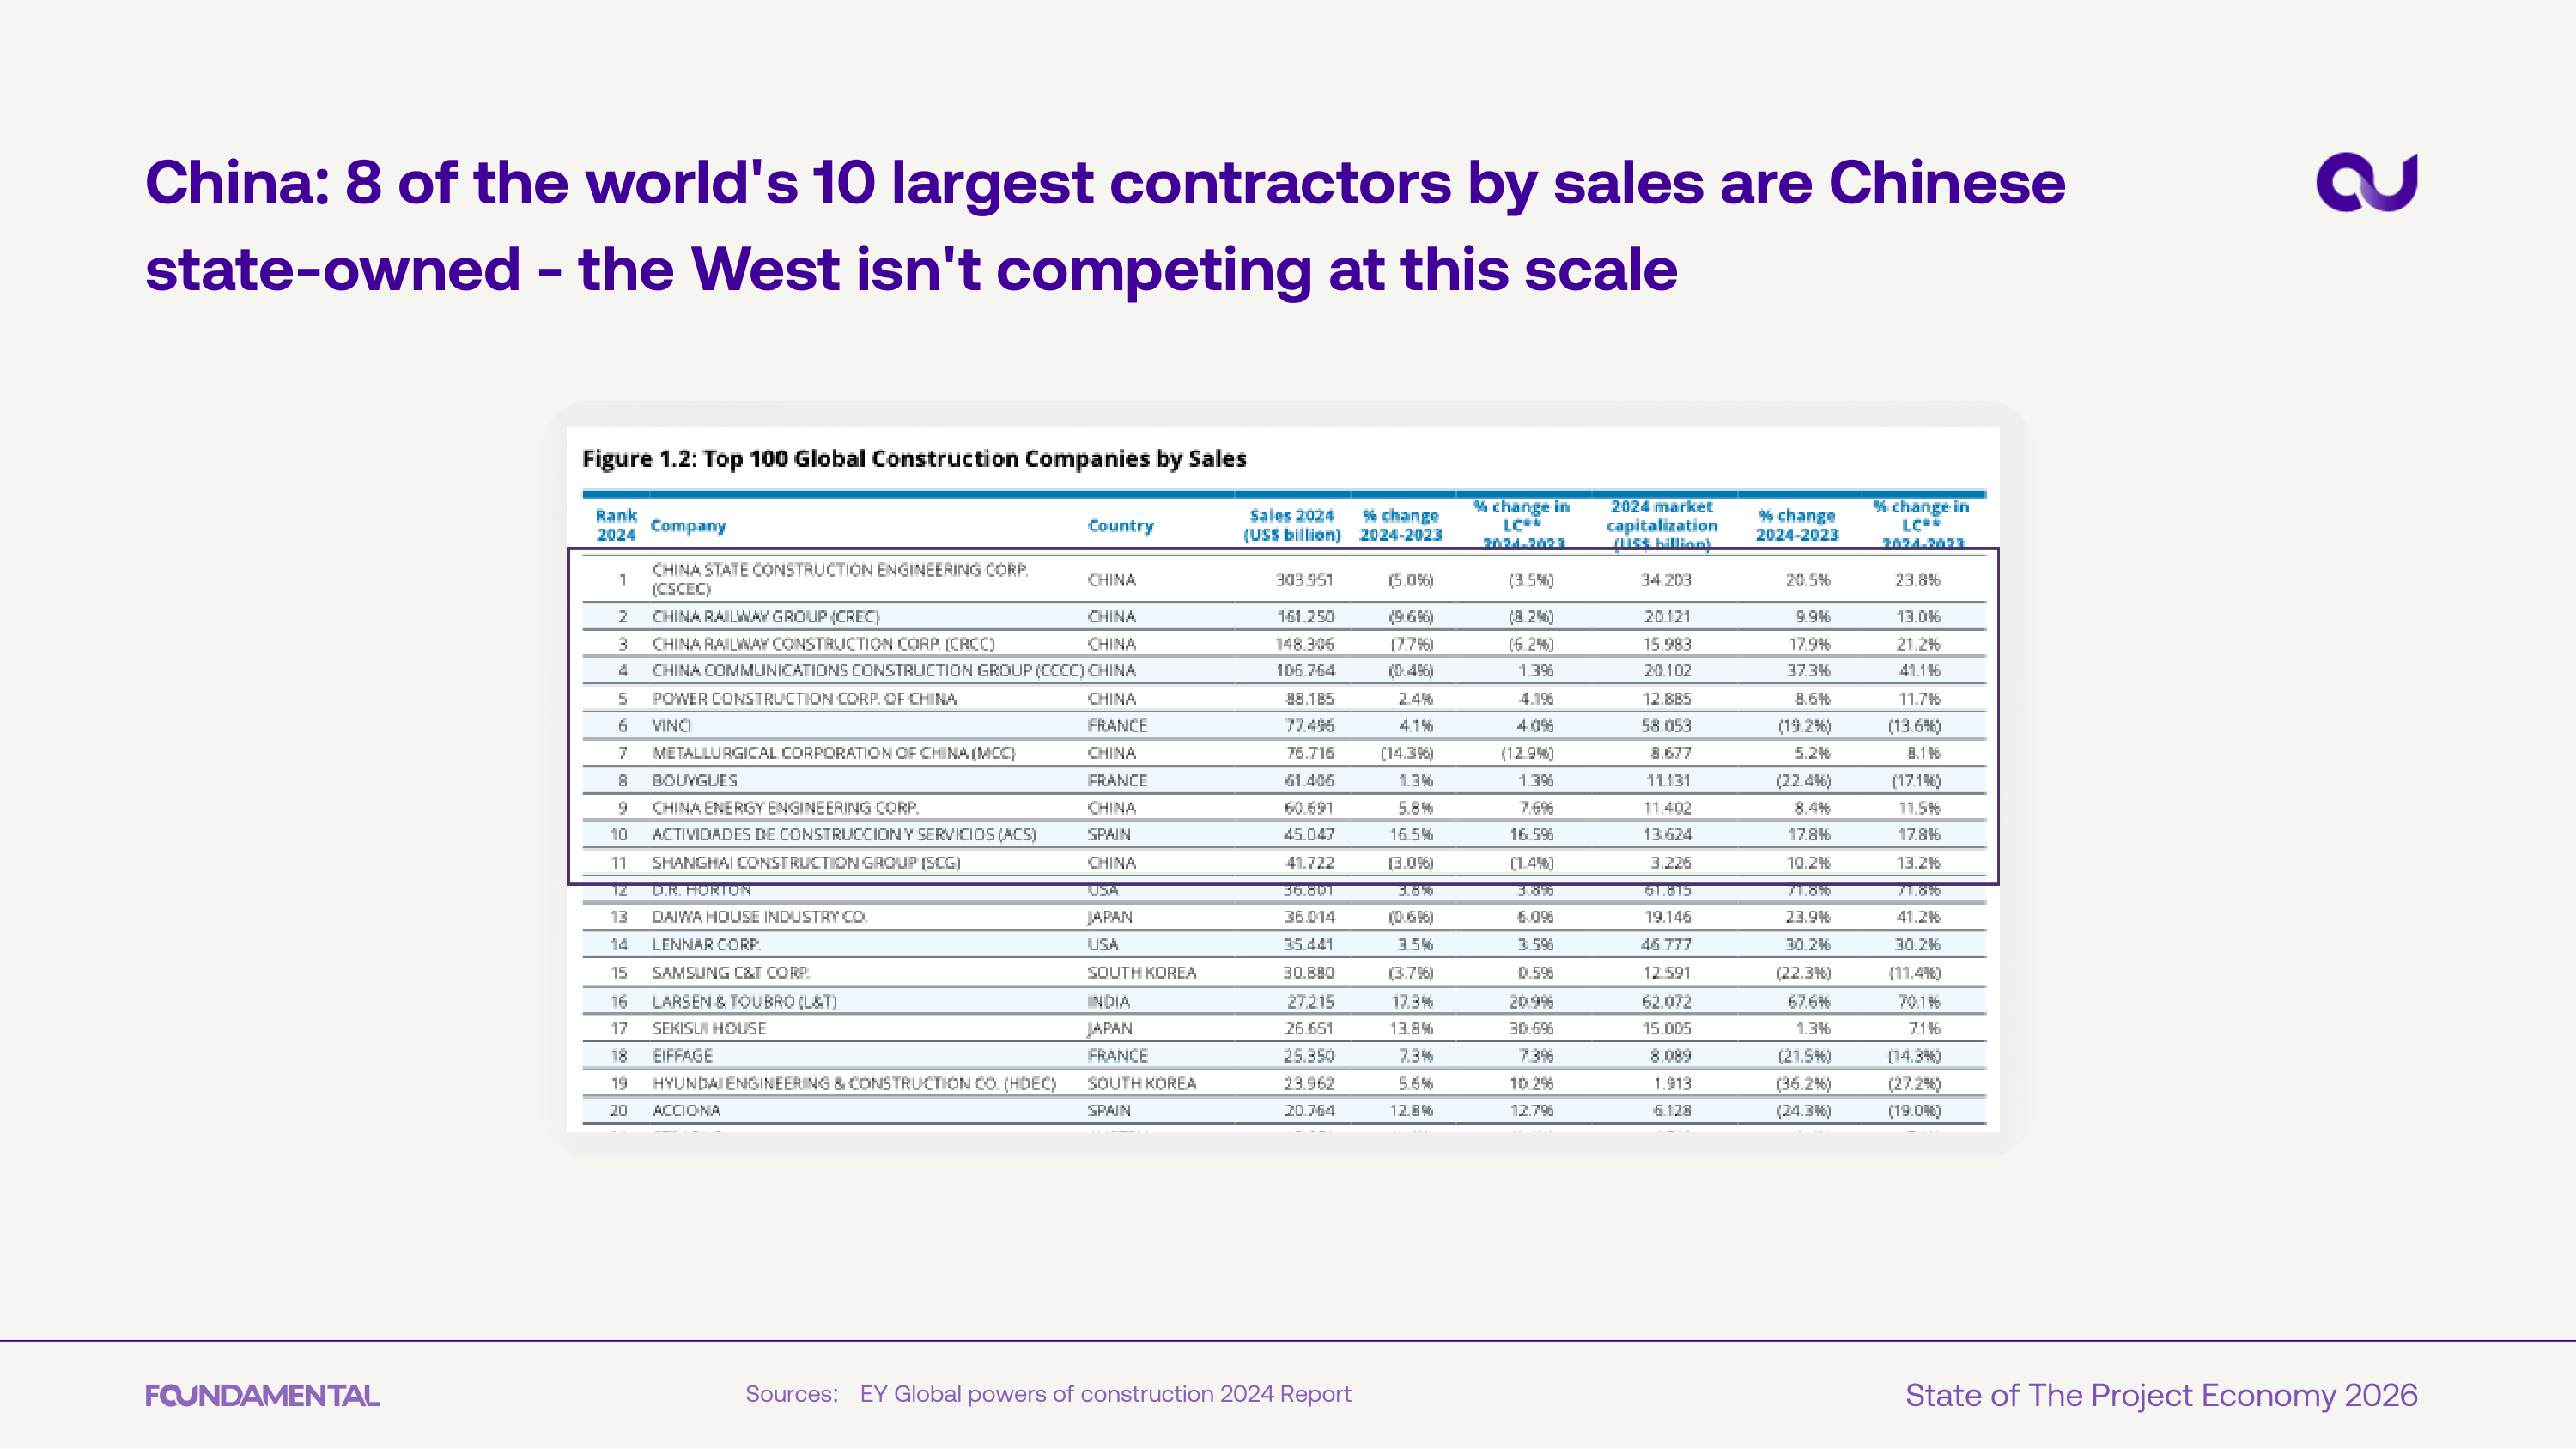
Eight of the world's ten largest contractors by sales are Chinese state-owned enterprises. The sheer scale of these firms means Western contractors are not competing on a level playing field.
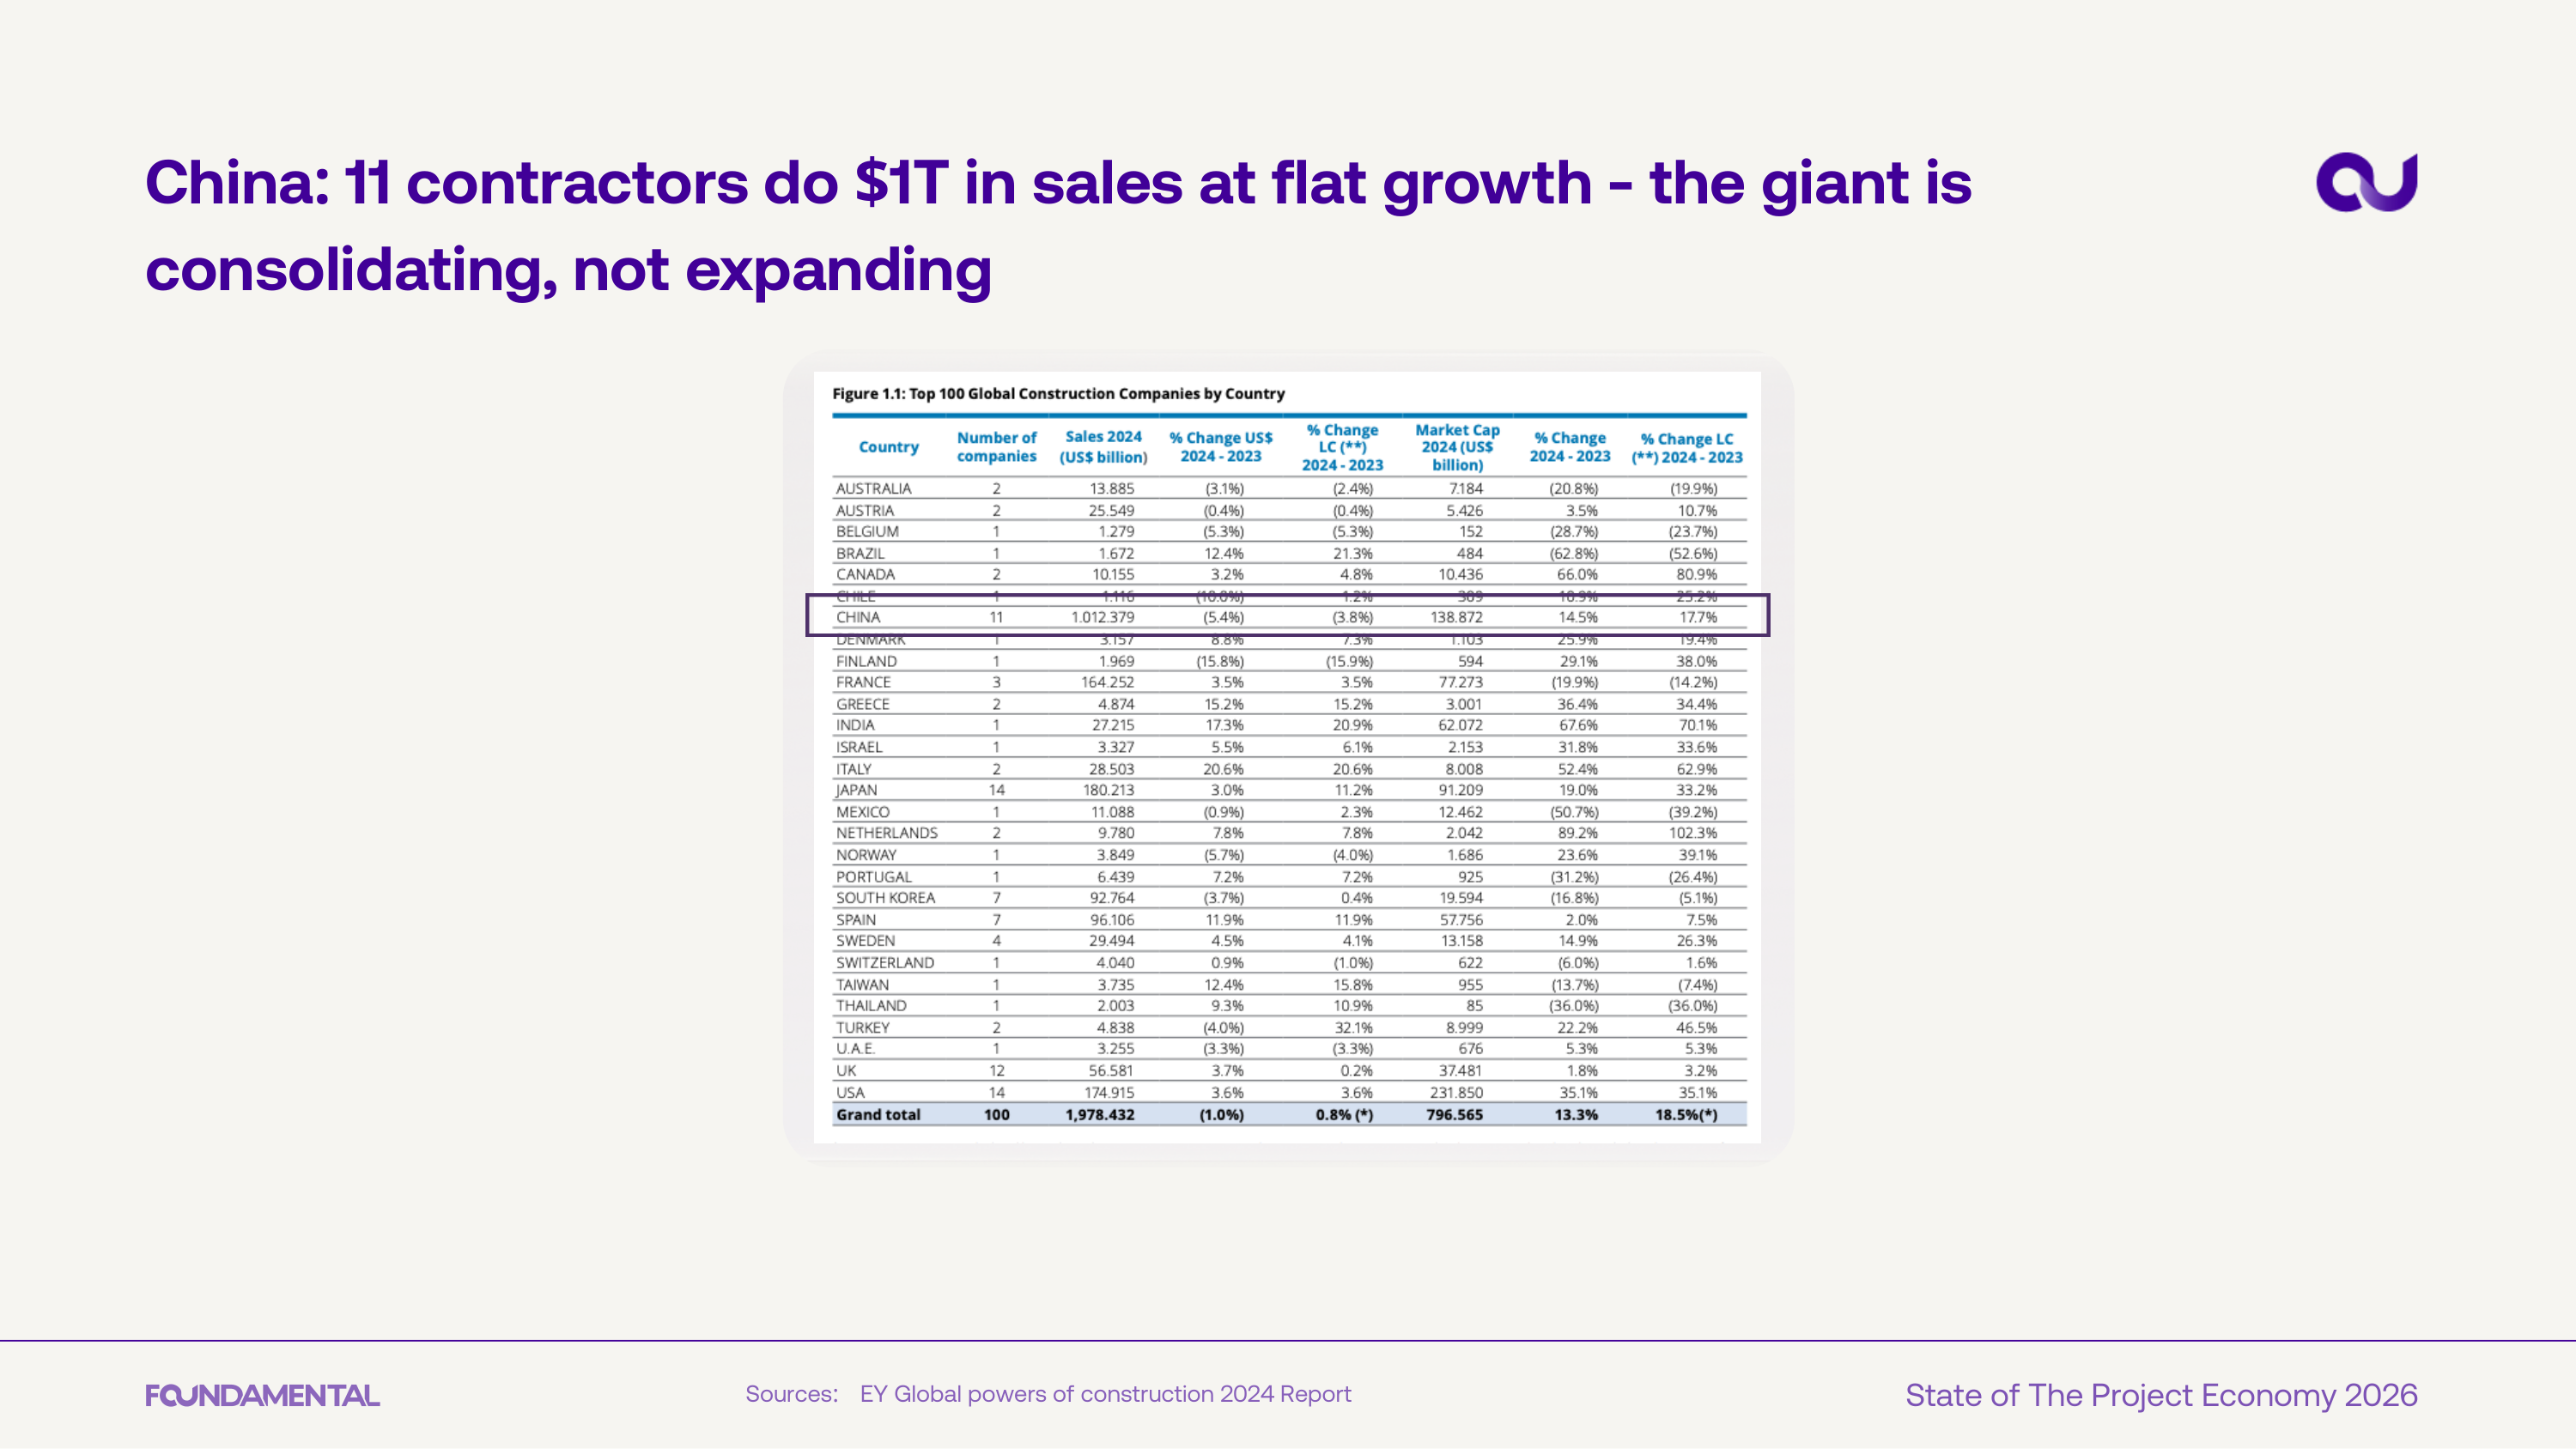
China's 11 largest contractors generate $1T in combined sales but at flat growth. The giant is consolidating, not expanding - a sign of market maturation in the world's largest construction economy.
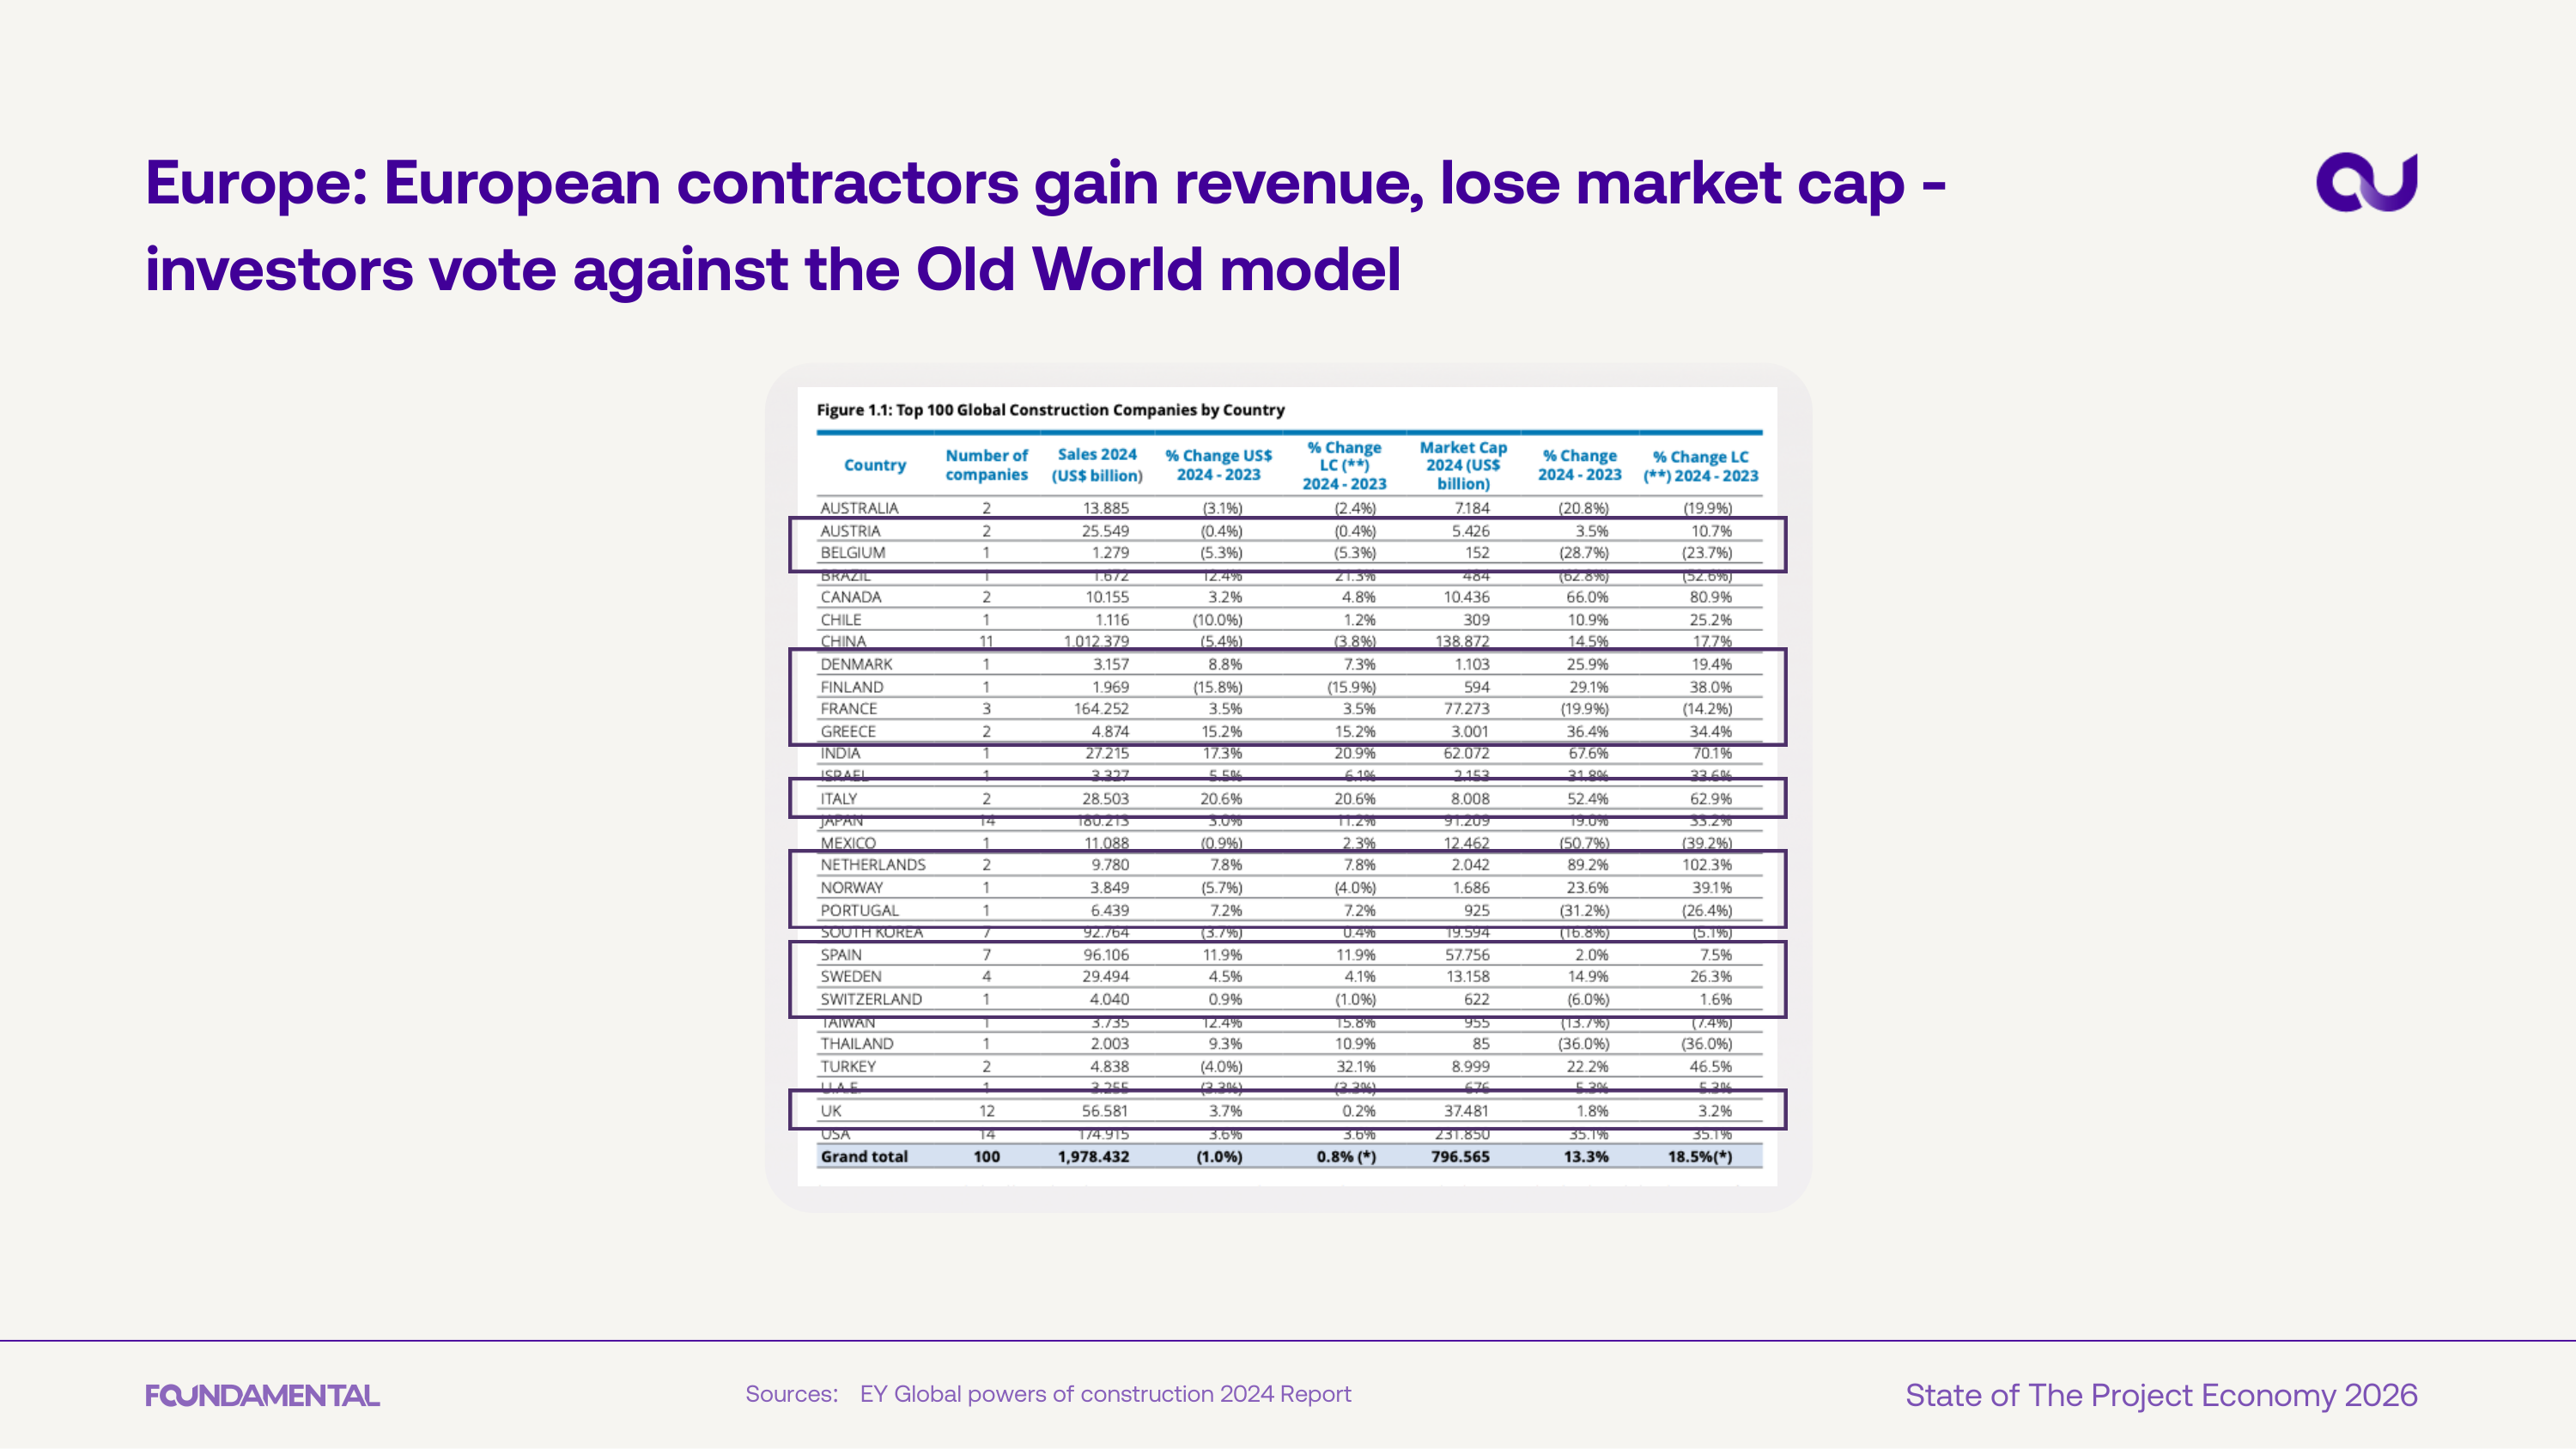
European contractors are growing revenue but losing market capitalization. Investors are voting against the Old World model - margins and returns are not keeping pace with topline growth.
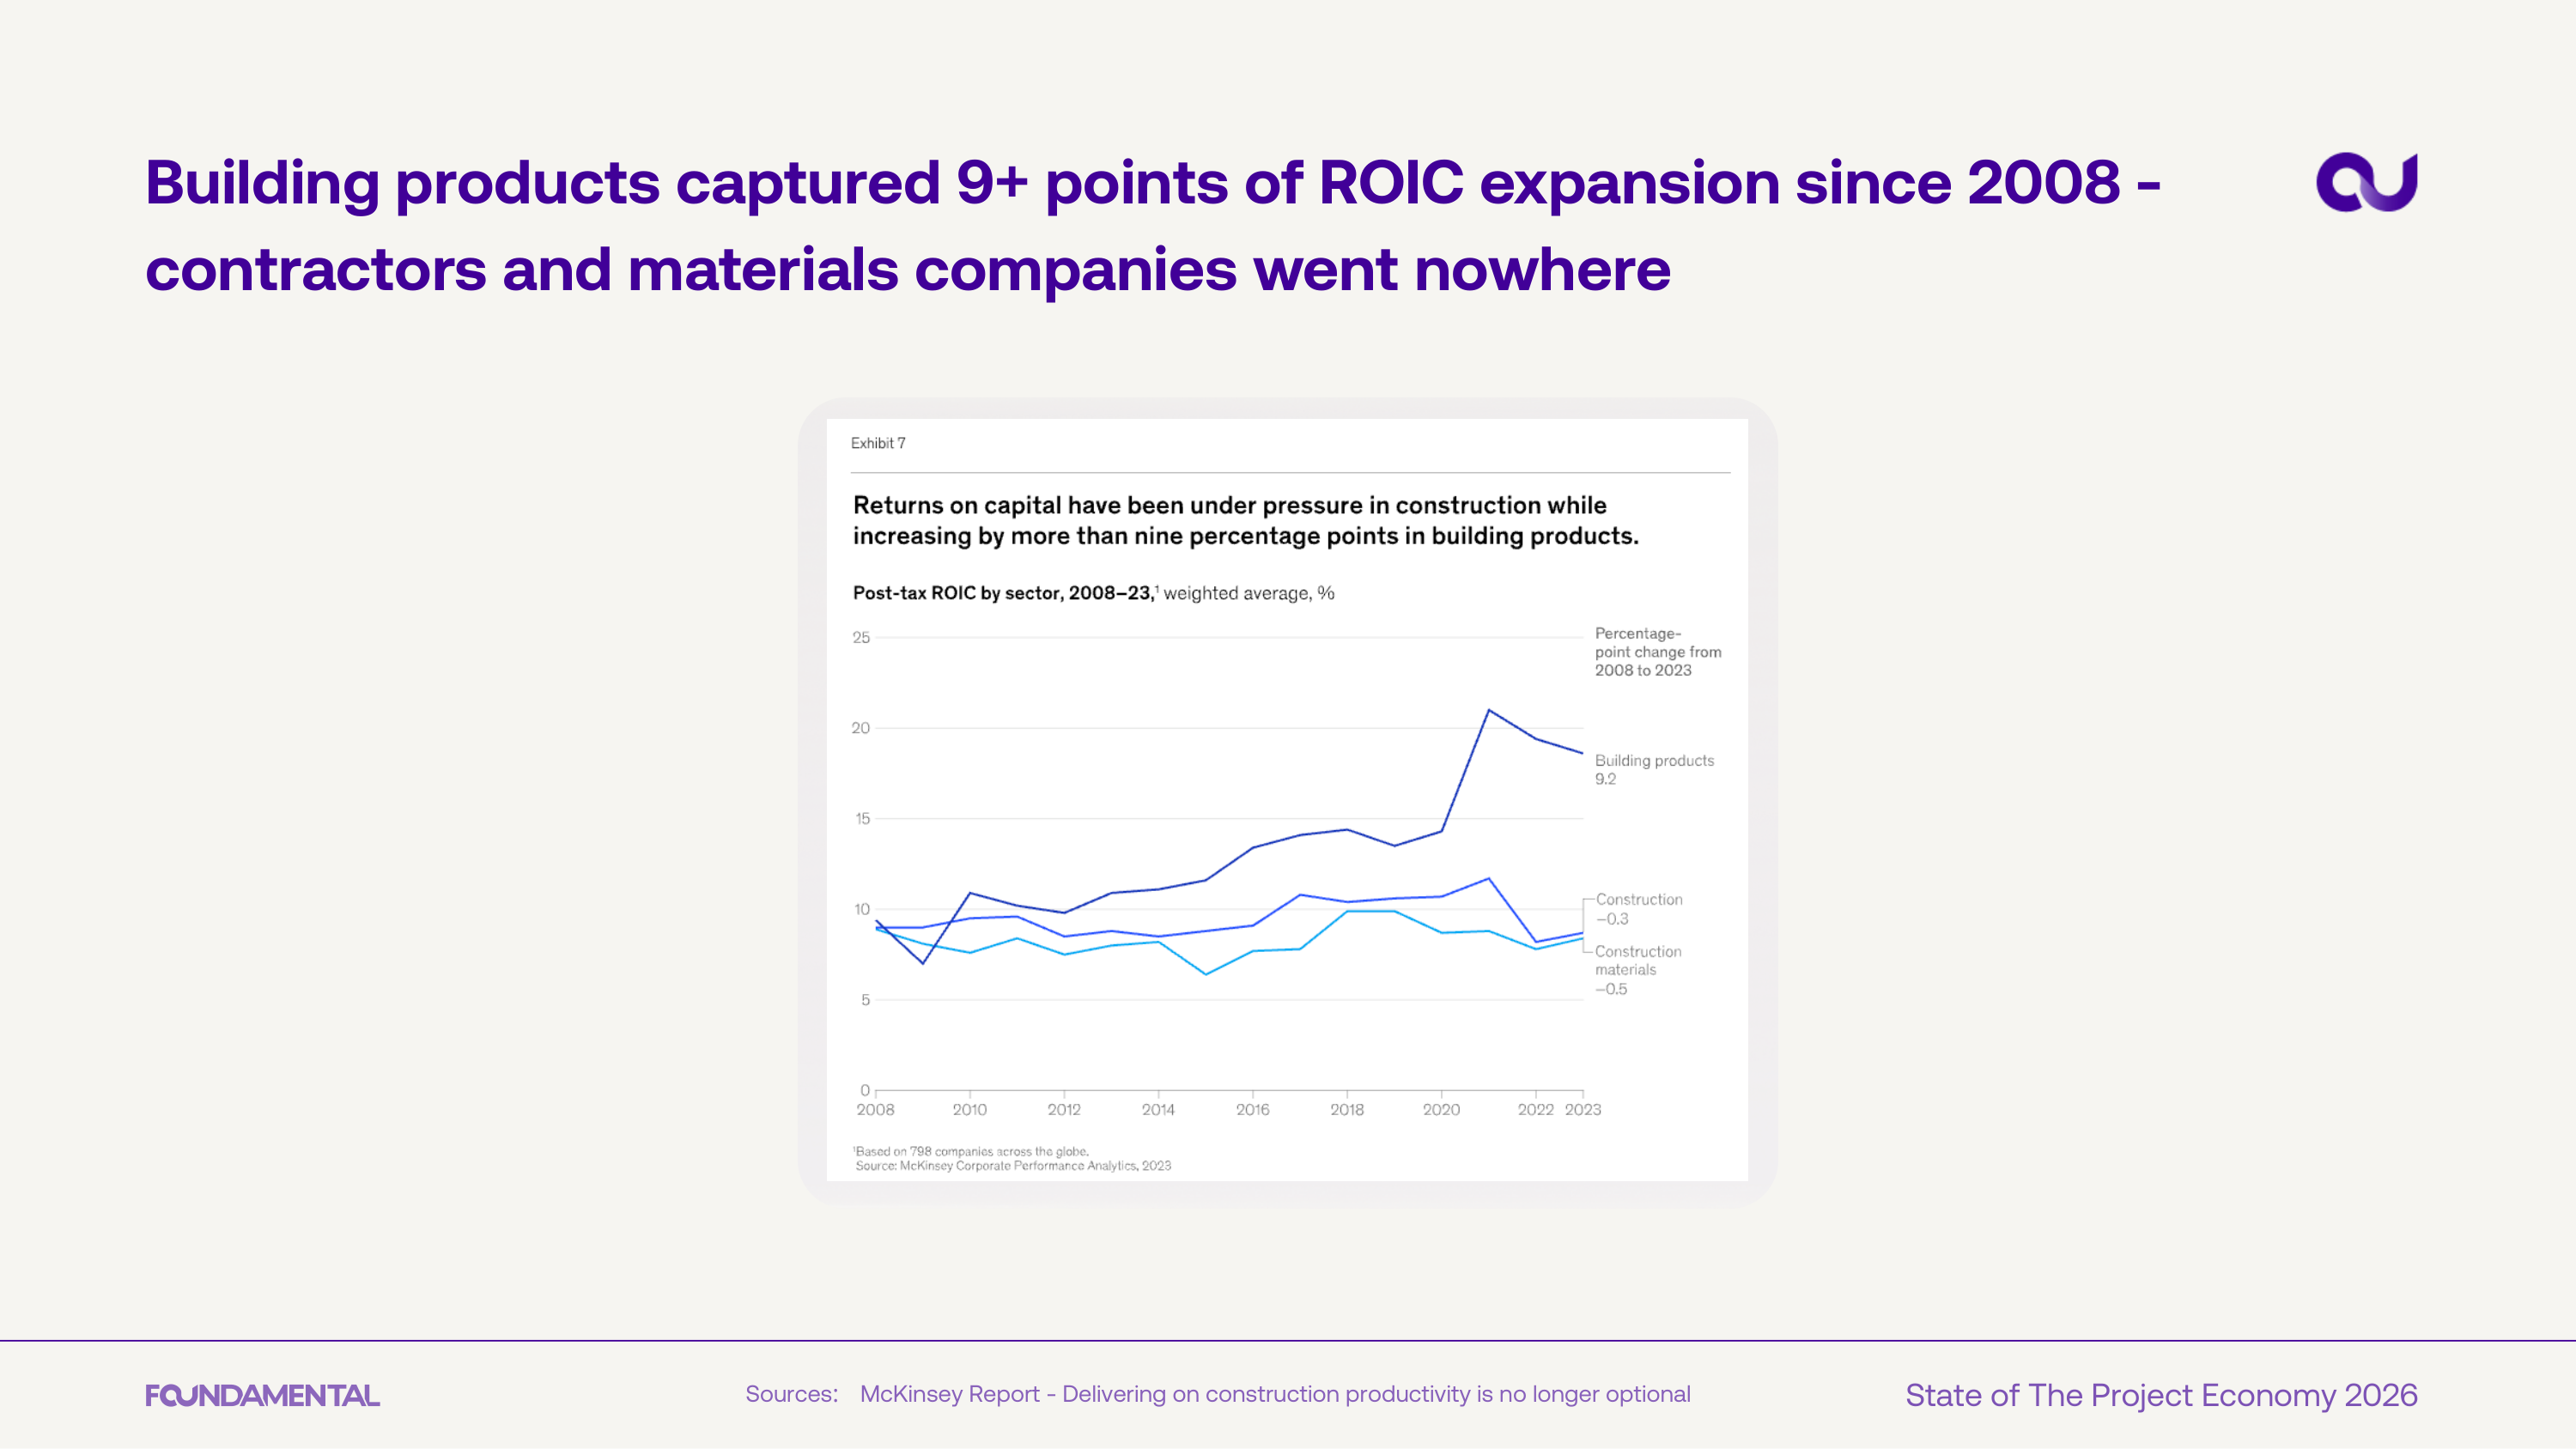
Since 2008, building products companies have captured more than 9 percentage points of ROIC expansion while contractors and materials companies flatlined. The value in construction is migrating upstream, away from the jobsite.

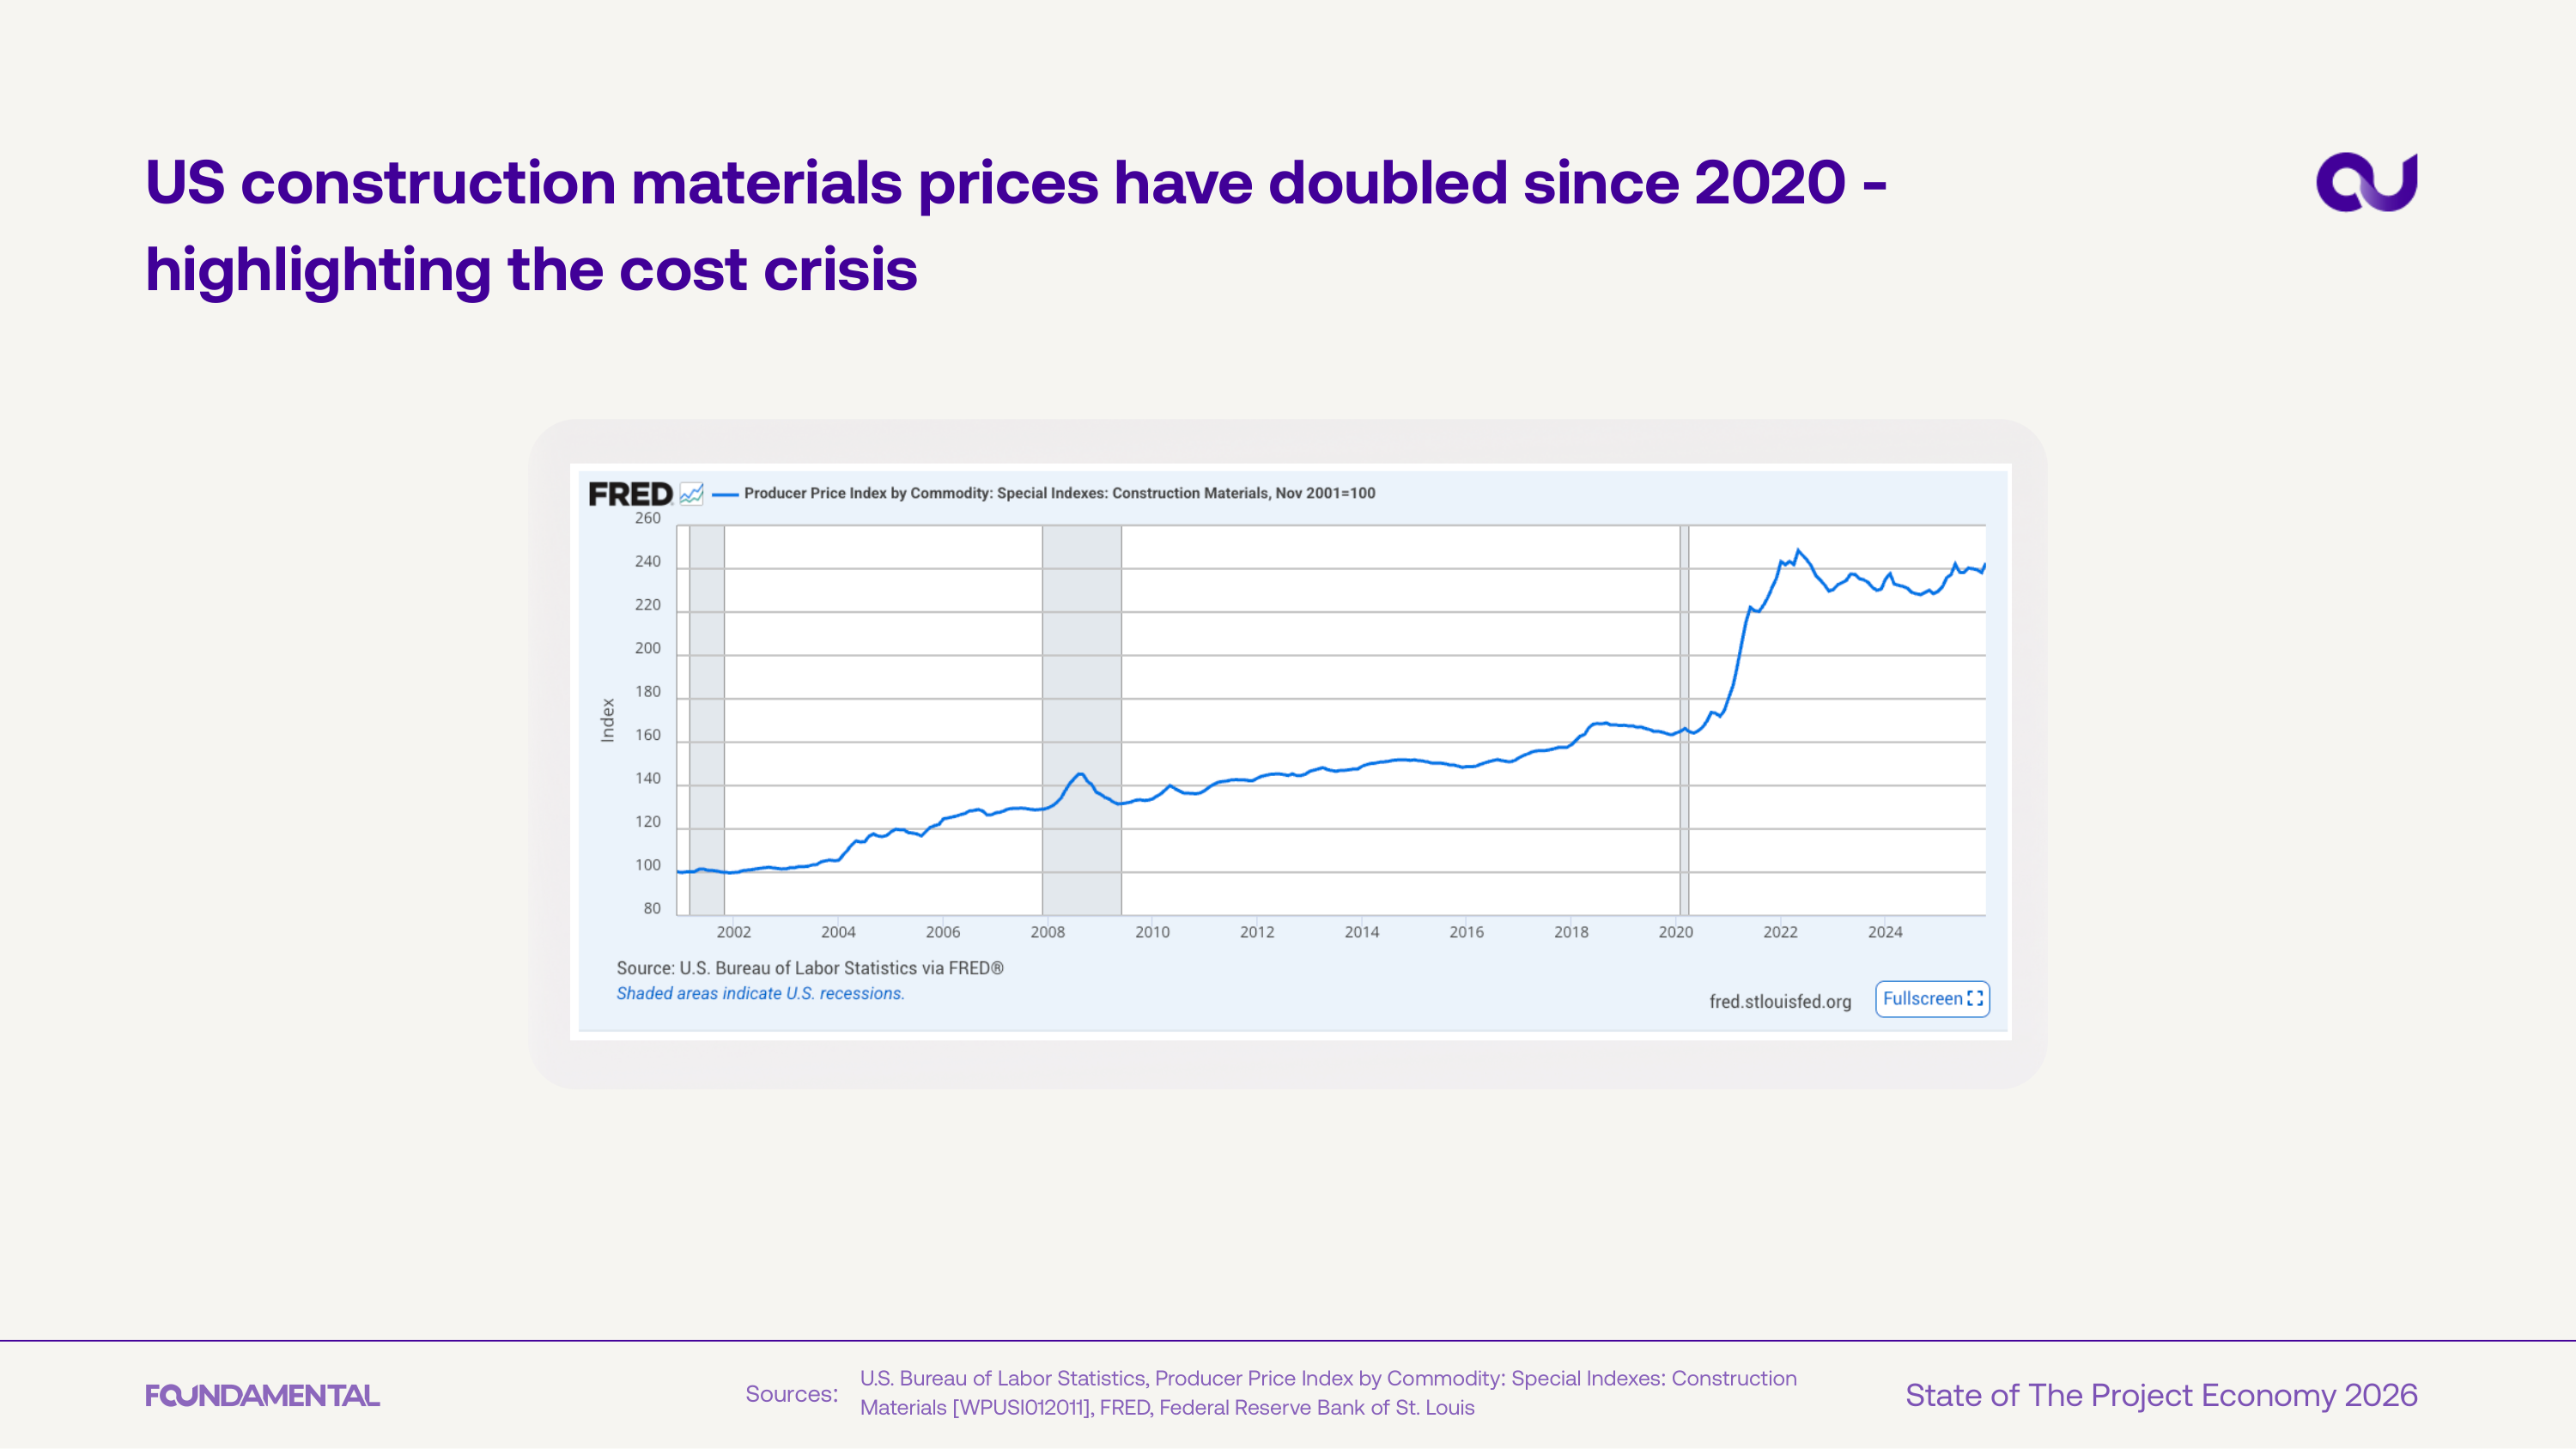
US construction materials prices have doubled since 2020 per the BLS Producer Price Index. The chart shows a sharp inflection around 2020 with no meaningful reversion since.
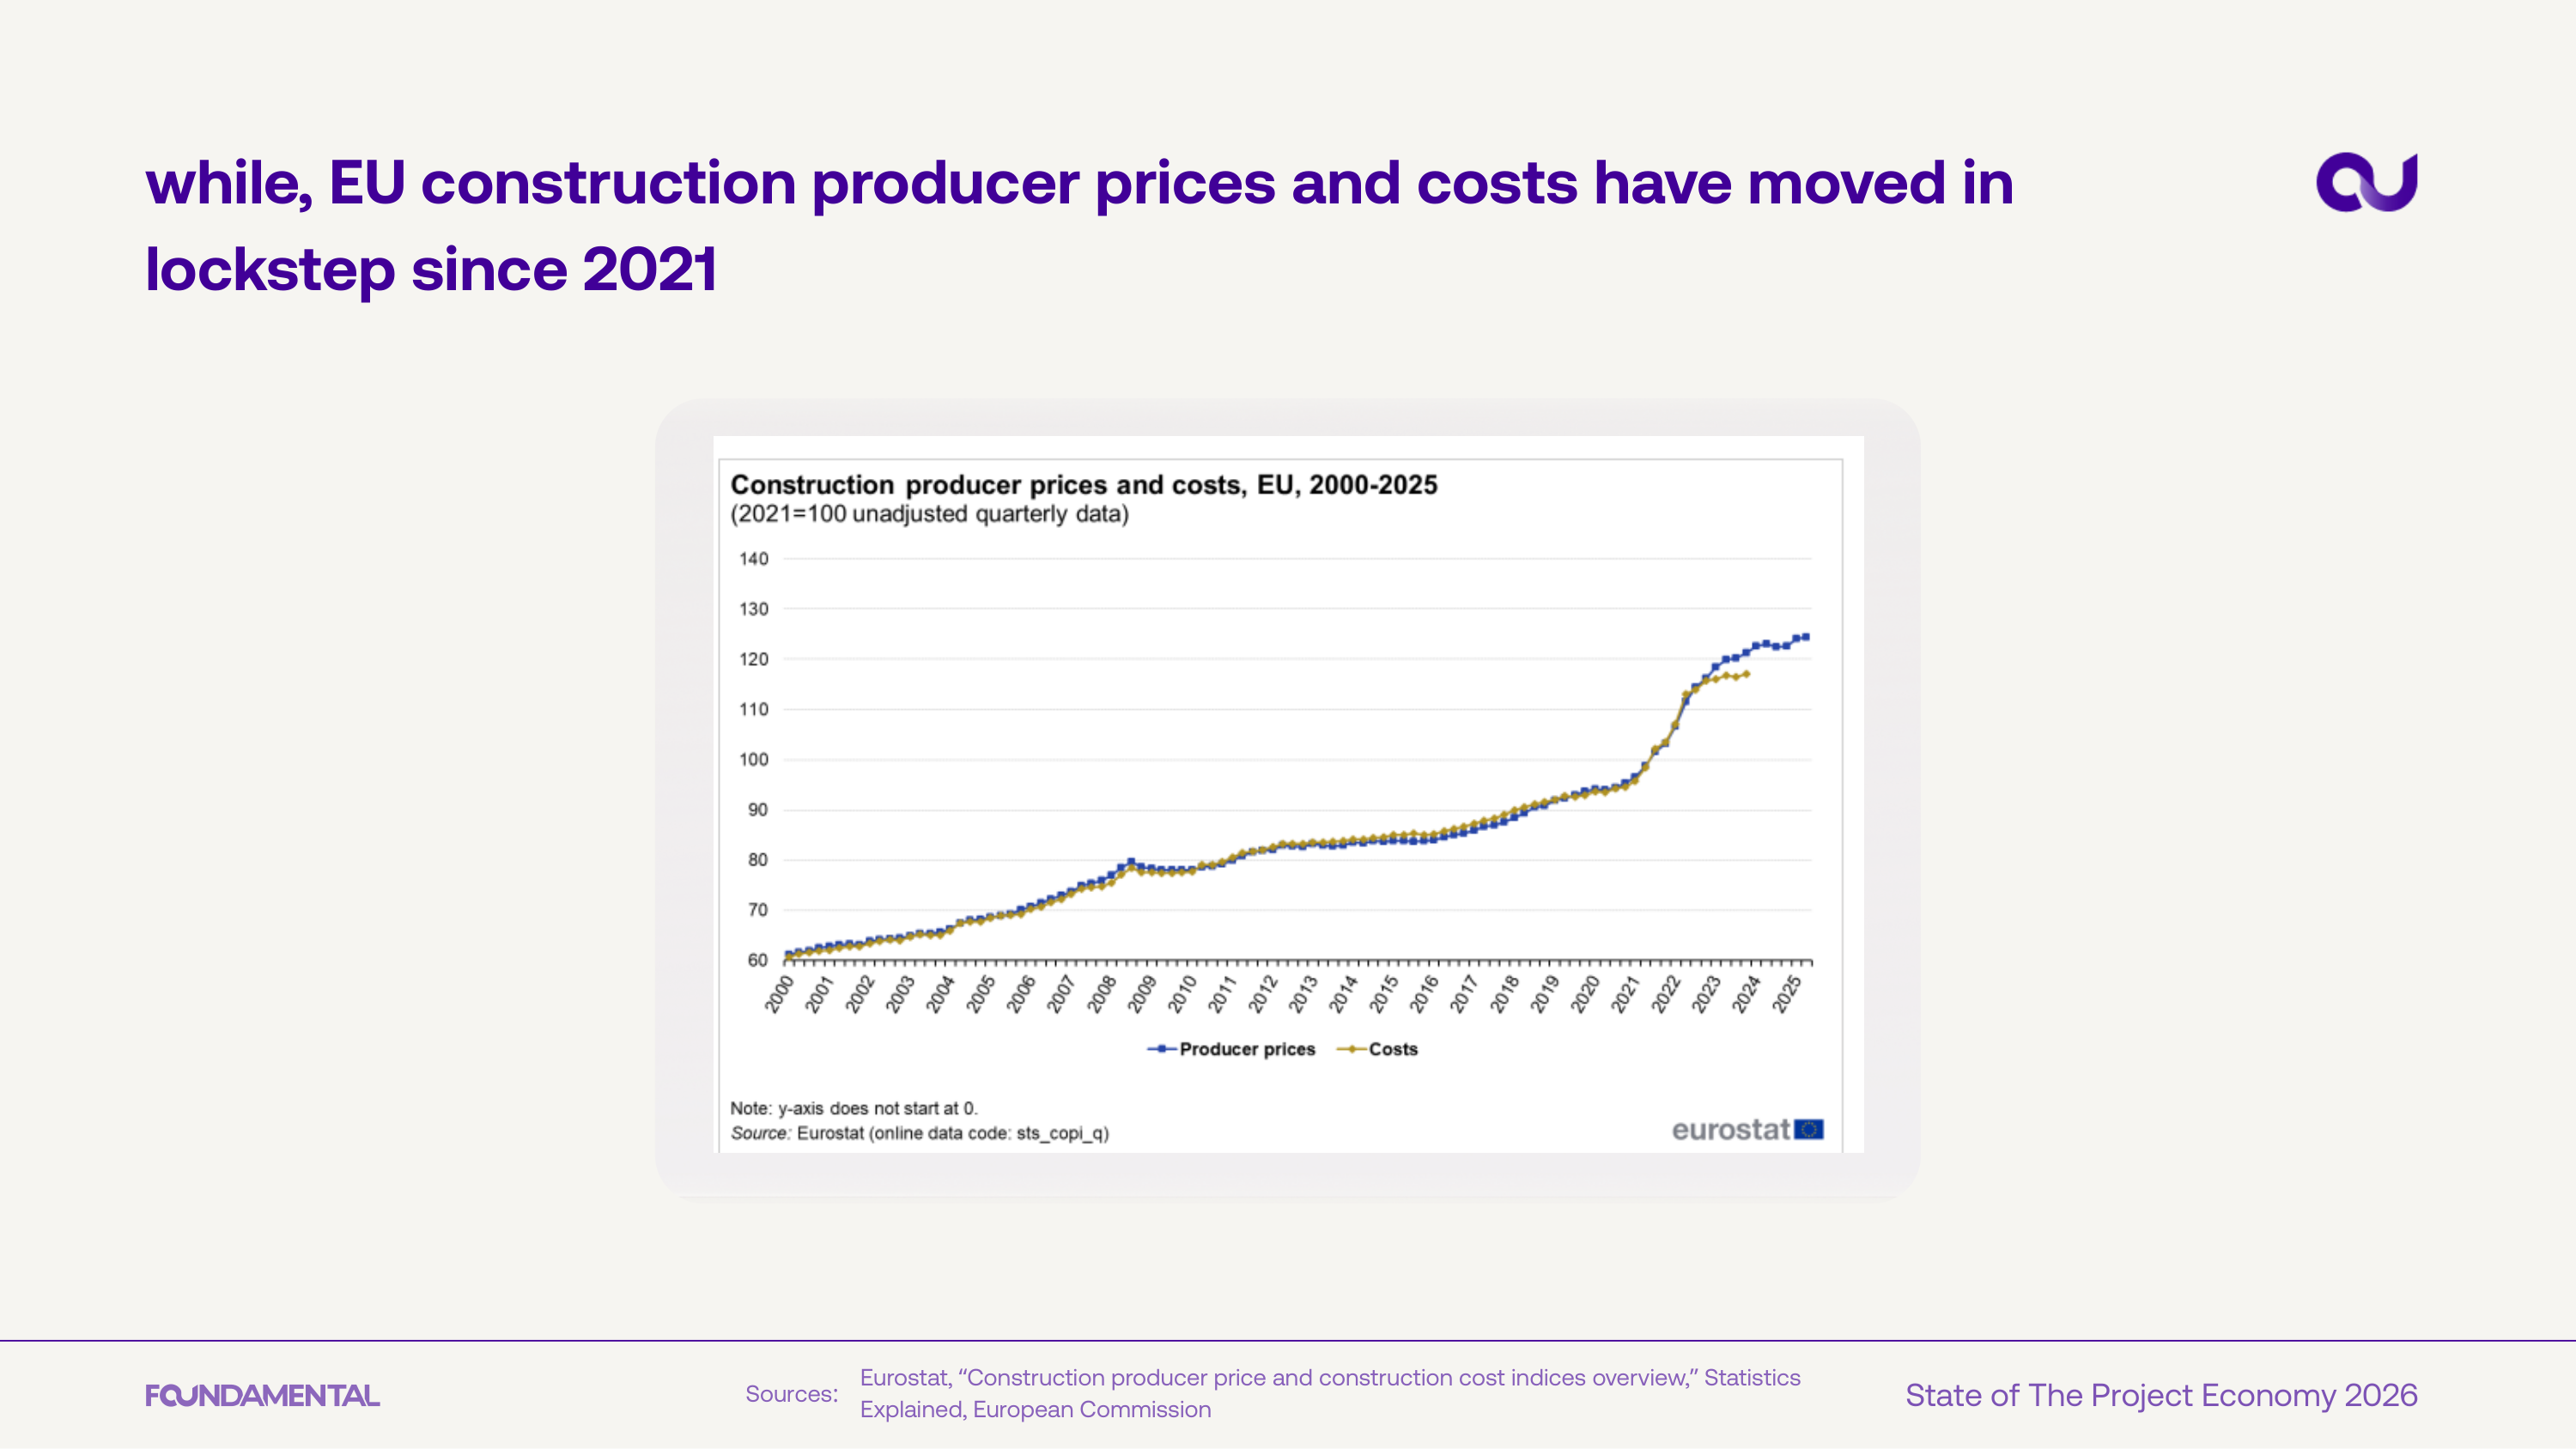
In the EU, construction producer prices and input costs have moved in lockstep since 2021. Contractors are unable to pass through cost increases, compressing margins across the value chain.
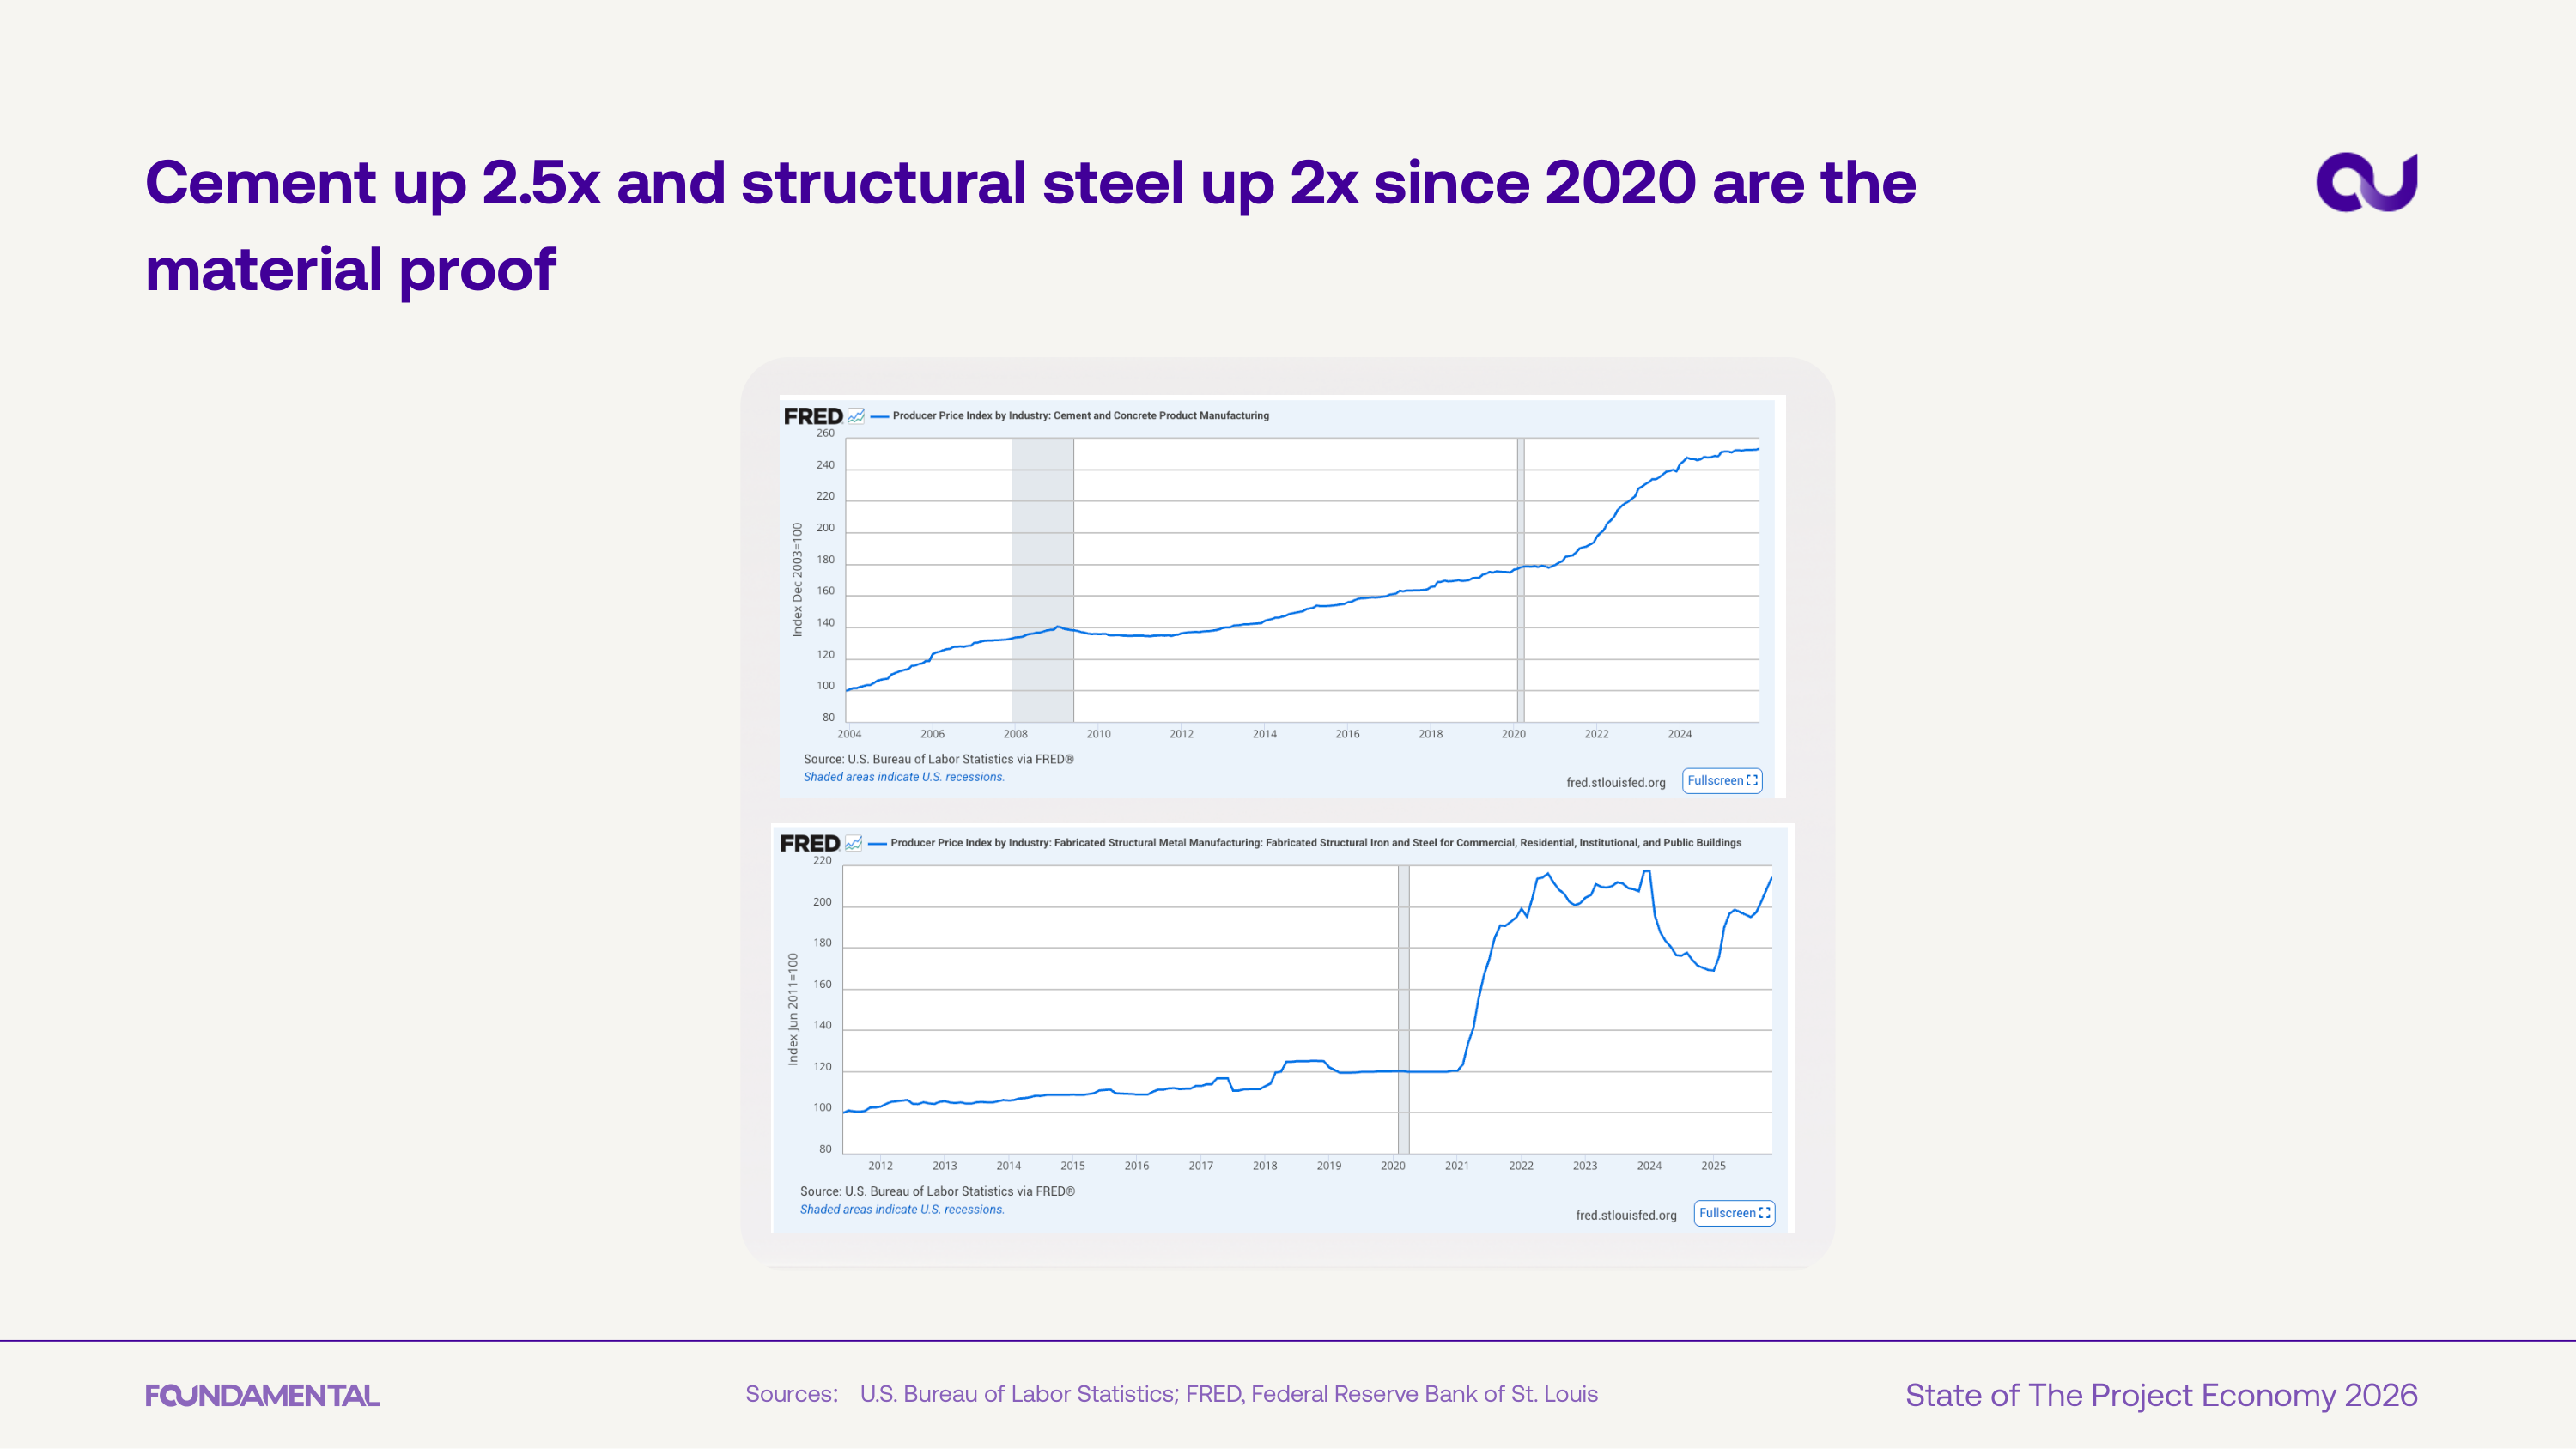
Cement prices have risen 2.5x and structural steel 2x since 2020, per FRED producer price index data. These aren't temporary spikes - the charts show a sustained step change in the cost base for every construction project.
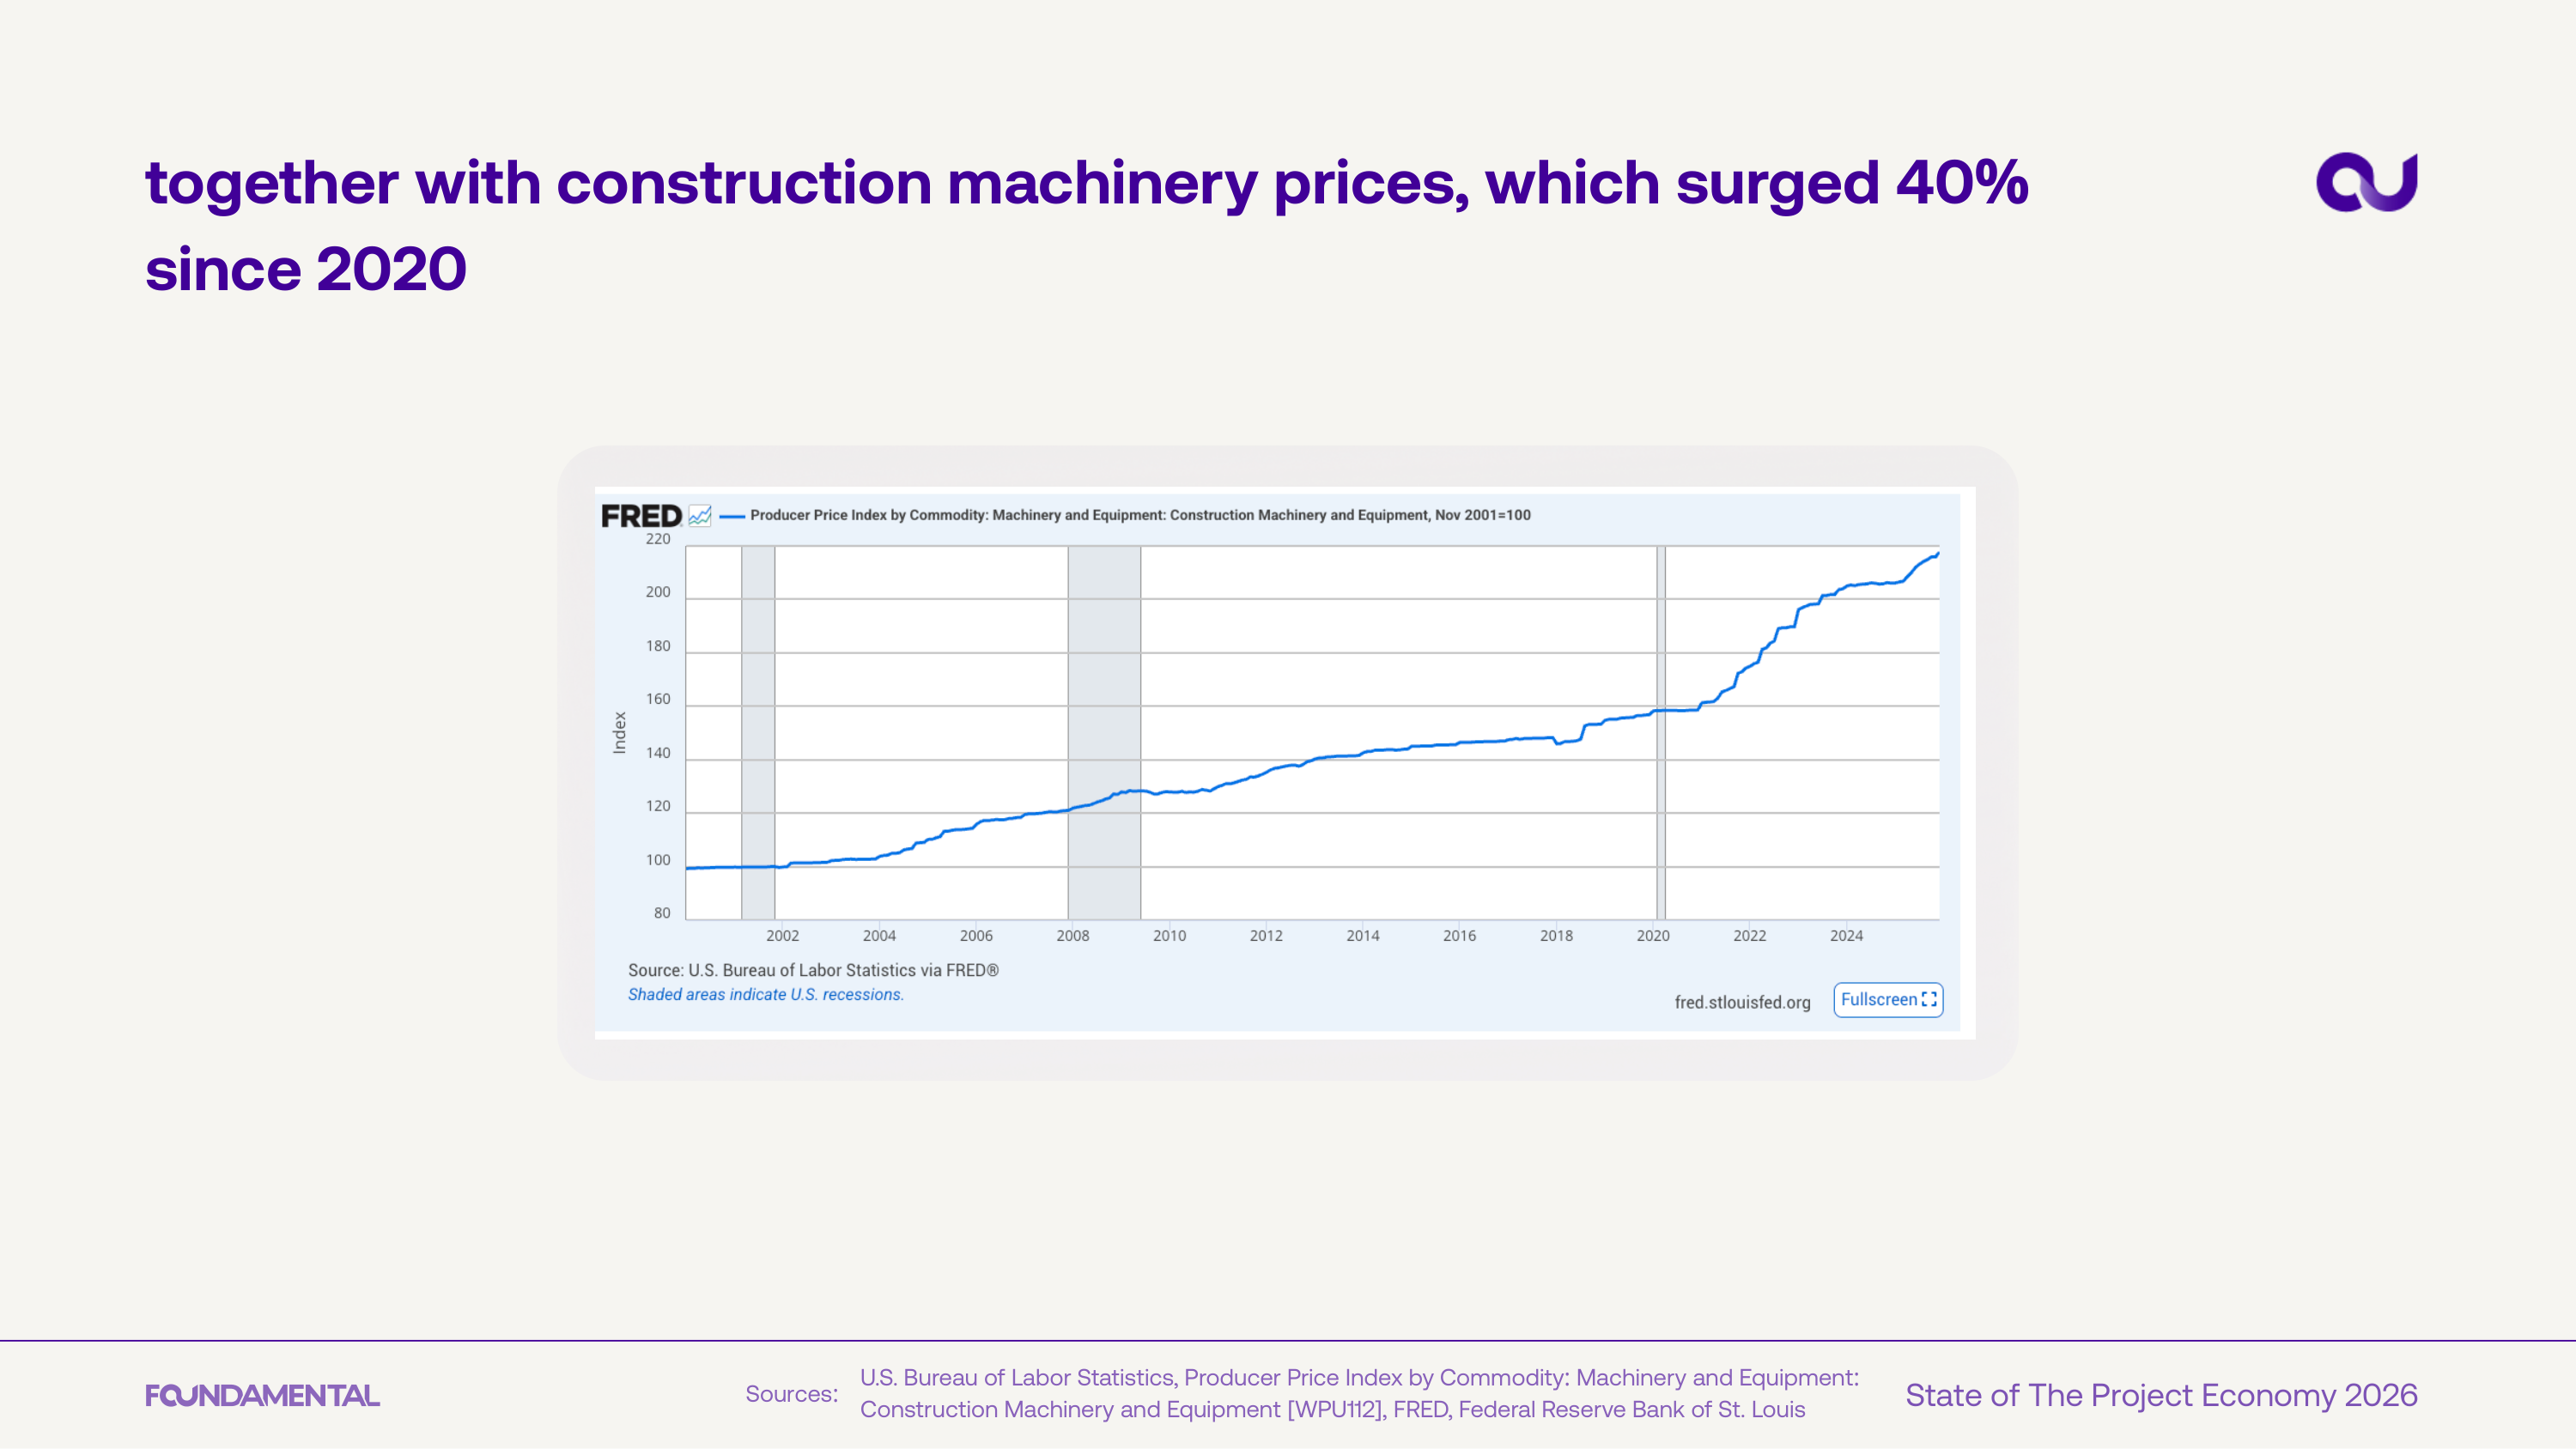
Construction machinery and equipment prices have surged 40% since 2020. Combined with materials inflation, the total cost of building has structurally reset to a higher level.
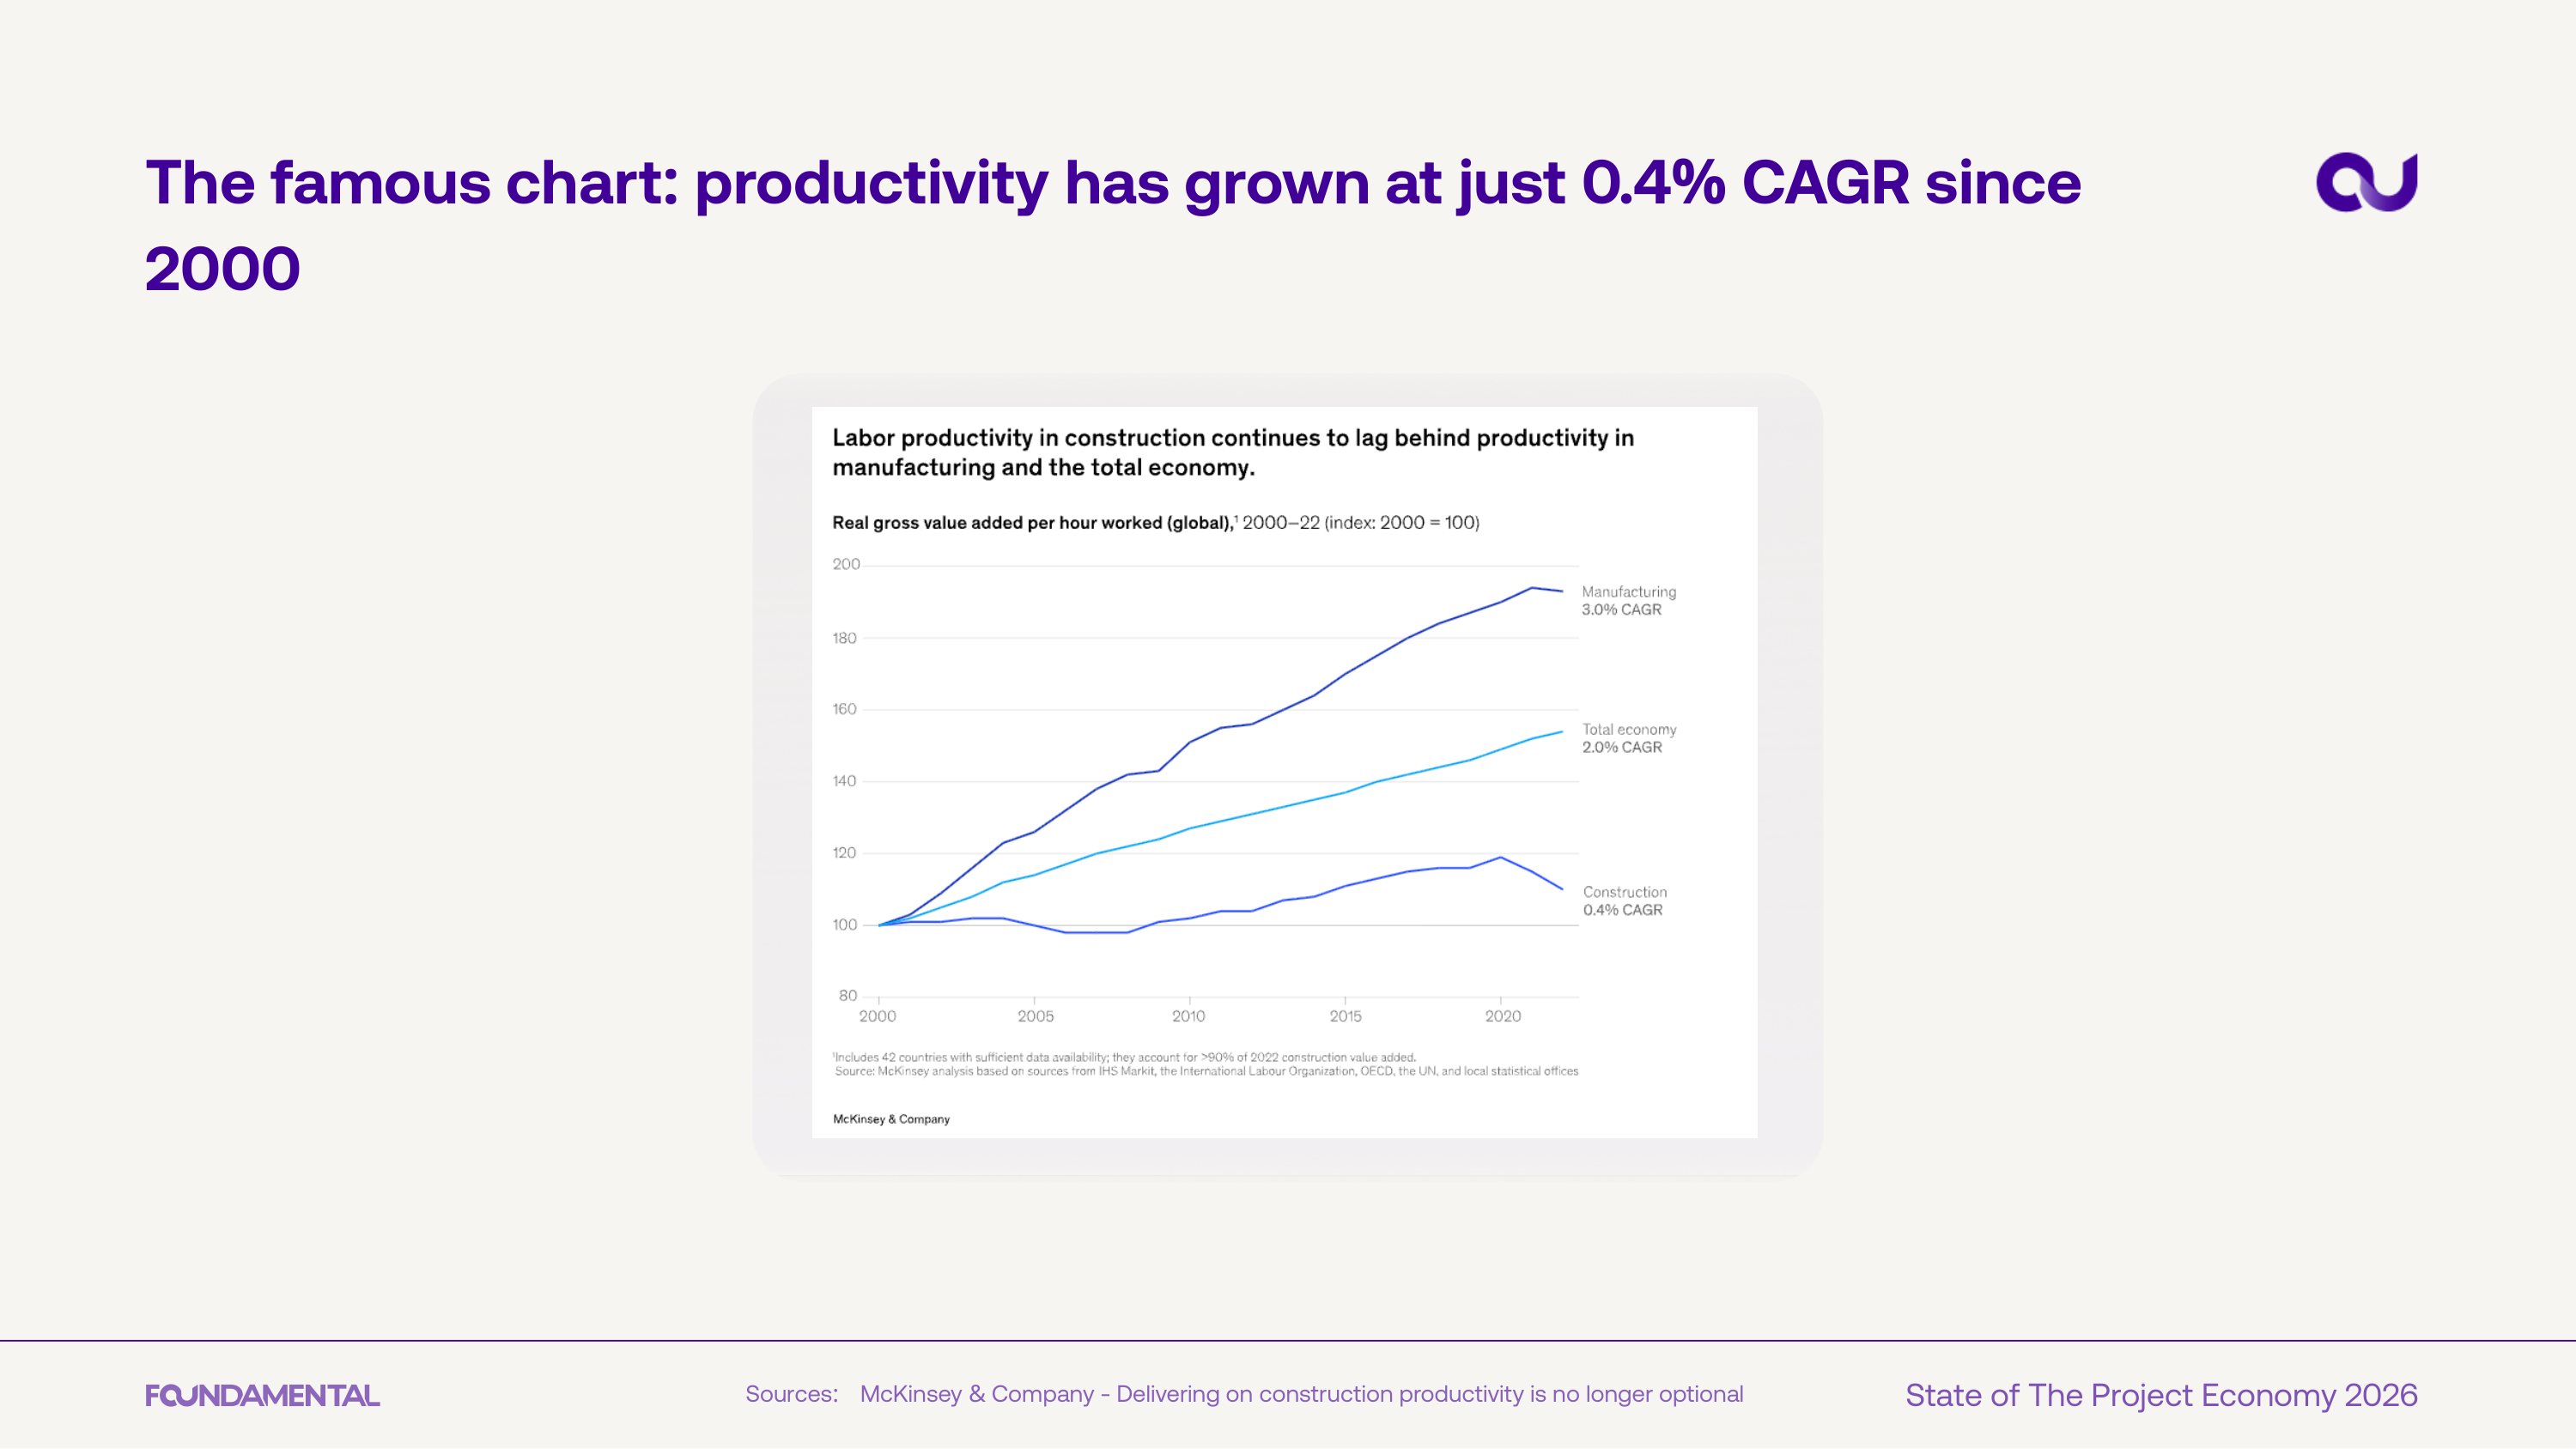
Construction labor productivity has grown at just 0.4% CAGR since 2000 - compared to 3.6% in manufacturing and 2.0% across the total economy. Two decades of near-zero productivity gains define the structural challenge.
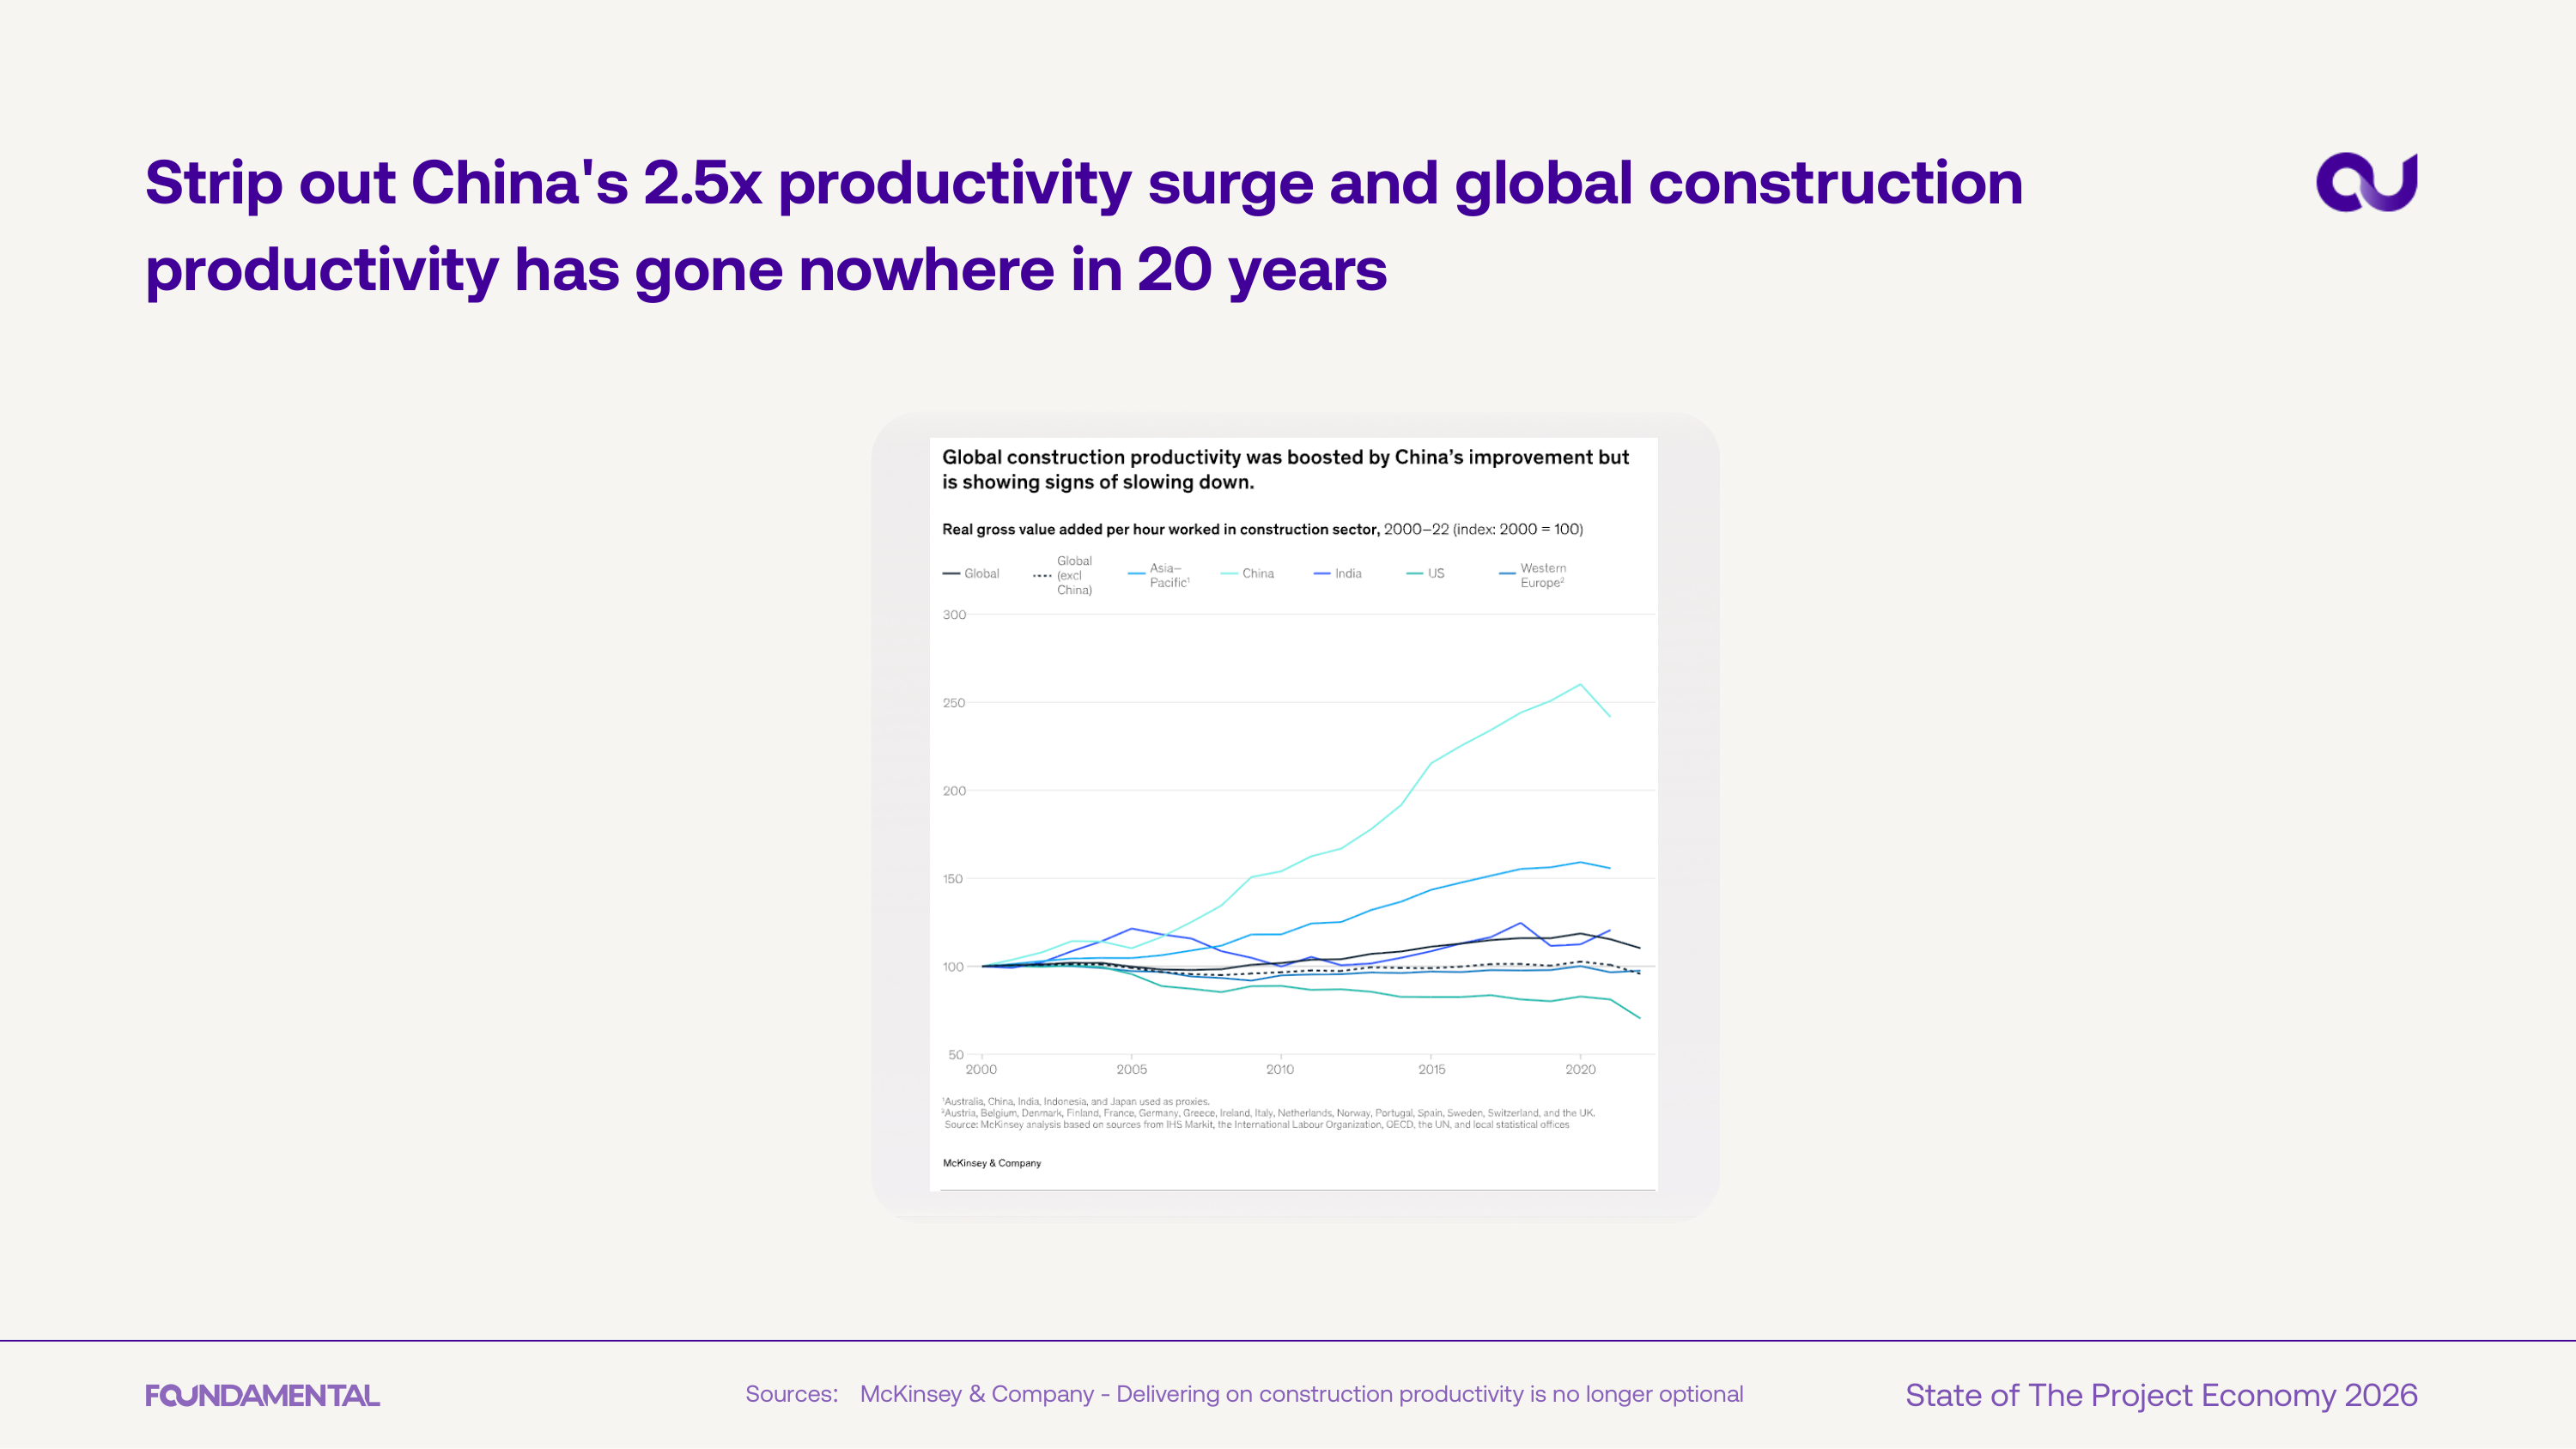
Strip out China's 2.5x productivity surge and global construction productivity has gone nowhere in 20 years. The US, Europe, and most other regions show flat or declining output per hour.
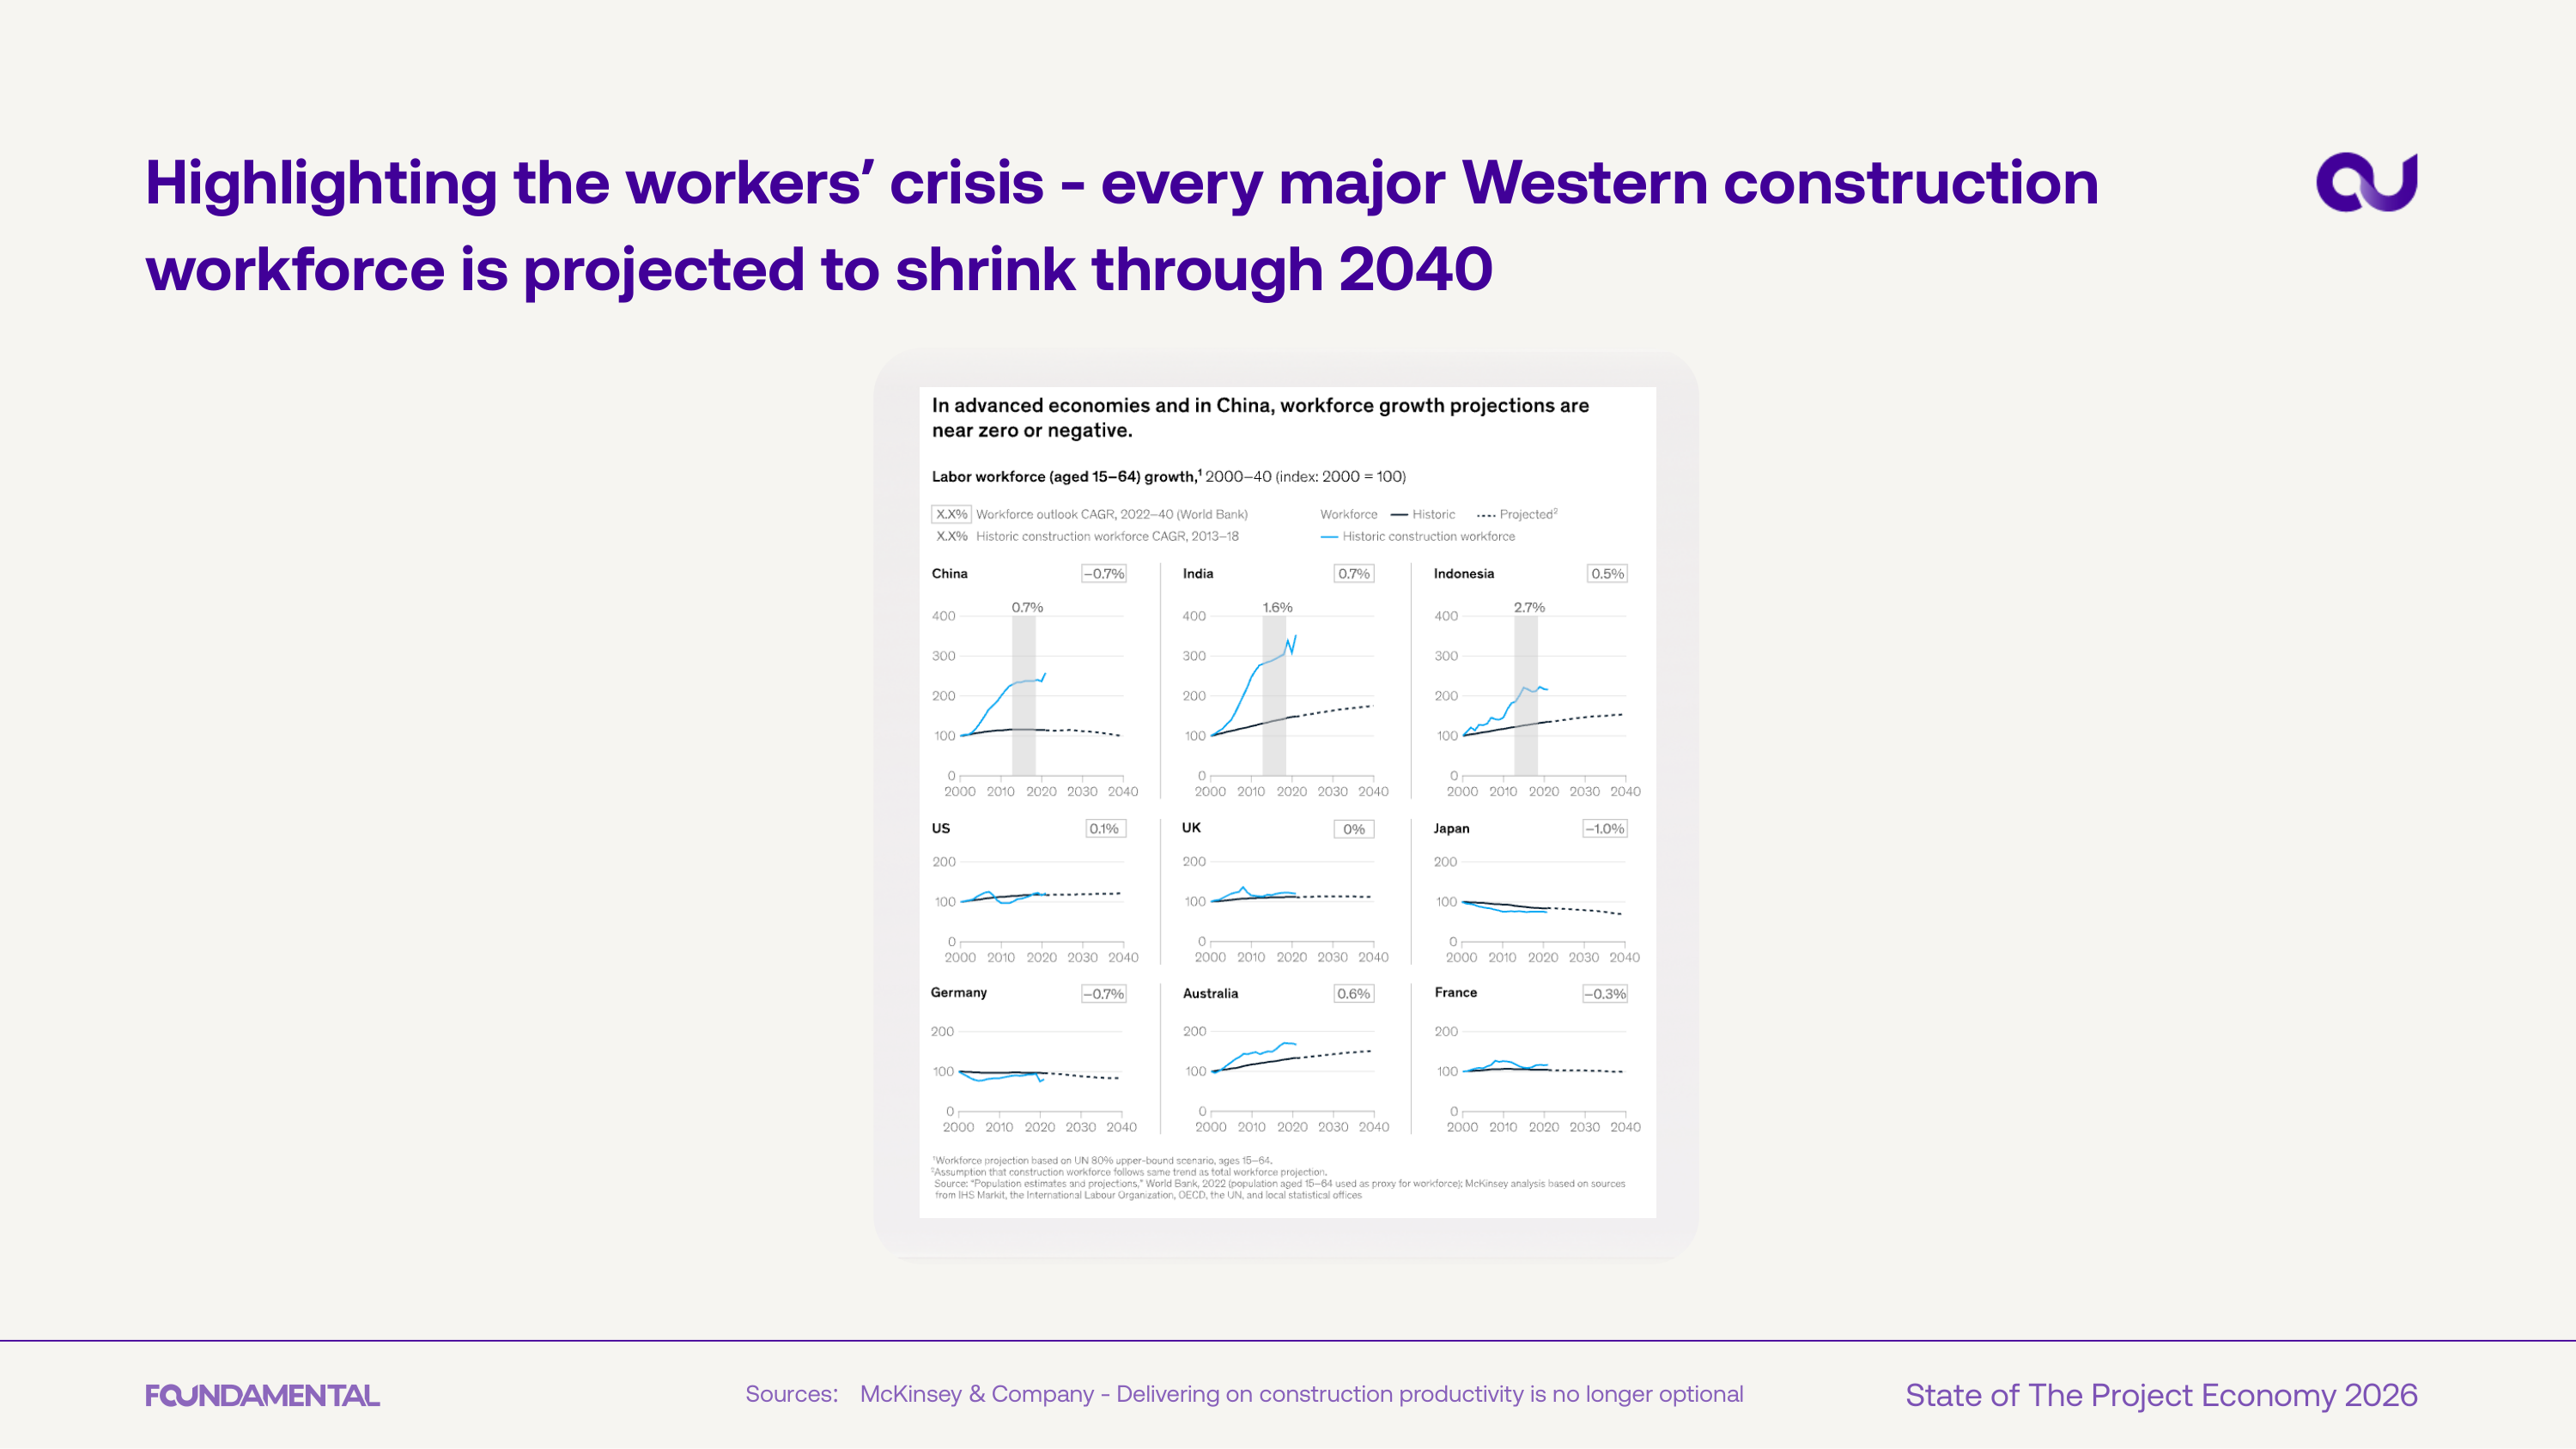
Every major Western construction workforce - US, UK, Germany, France, Australia, Japan - is projected to shrink through 2040. China's labor pool is also contracting. The industry faces a structural labor shortage with no demographic fix in sight.
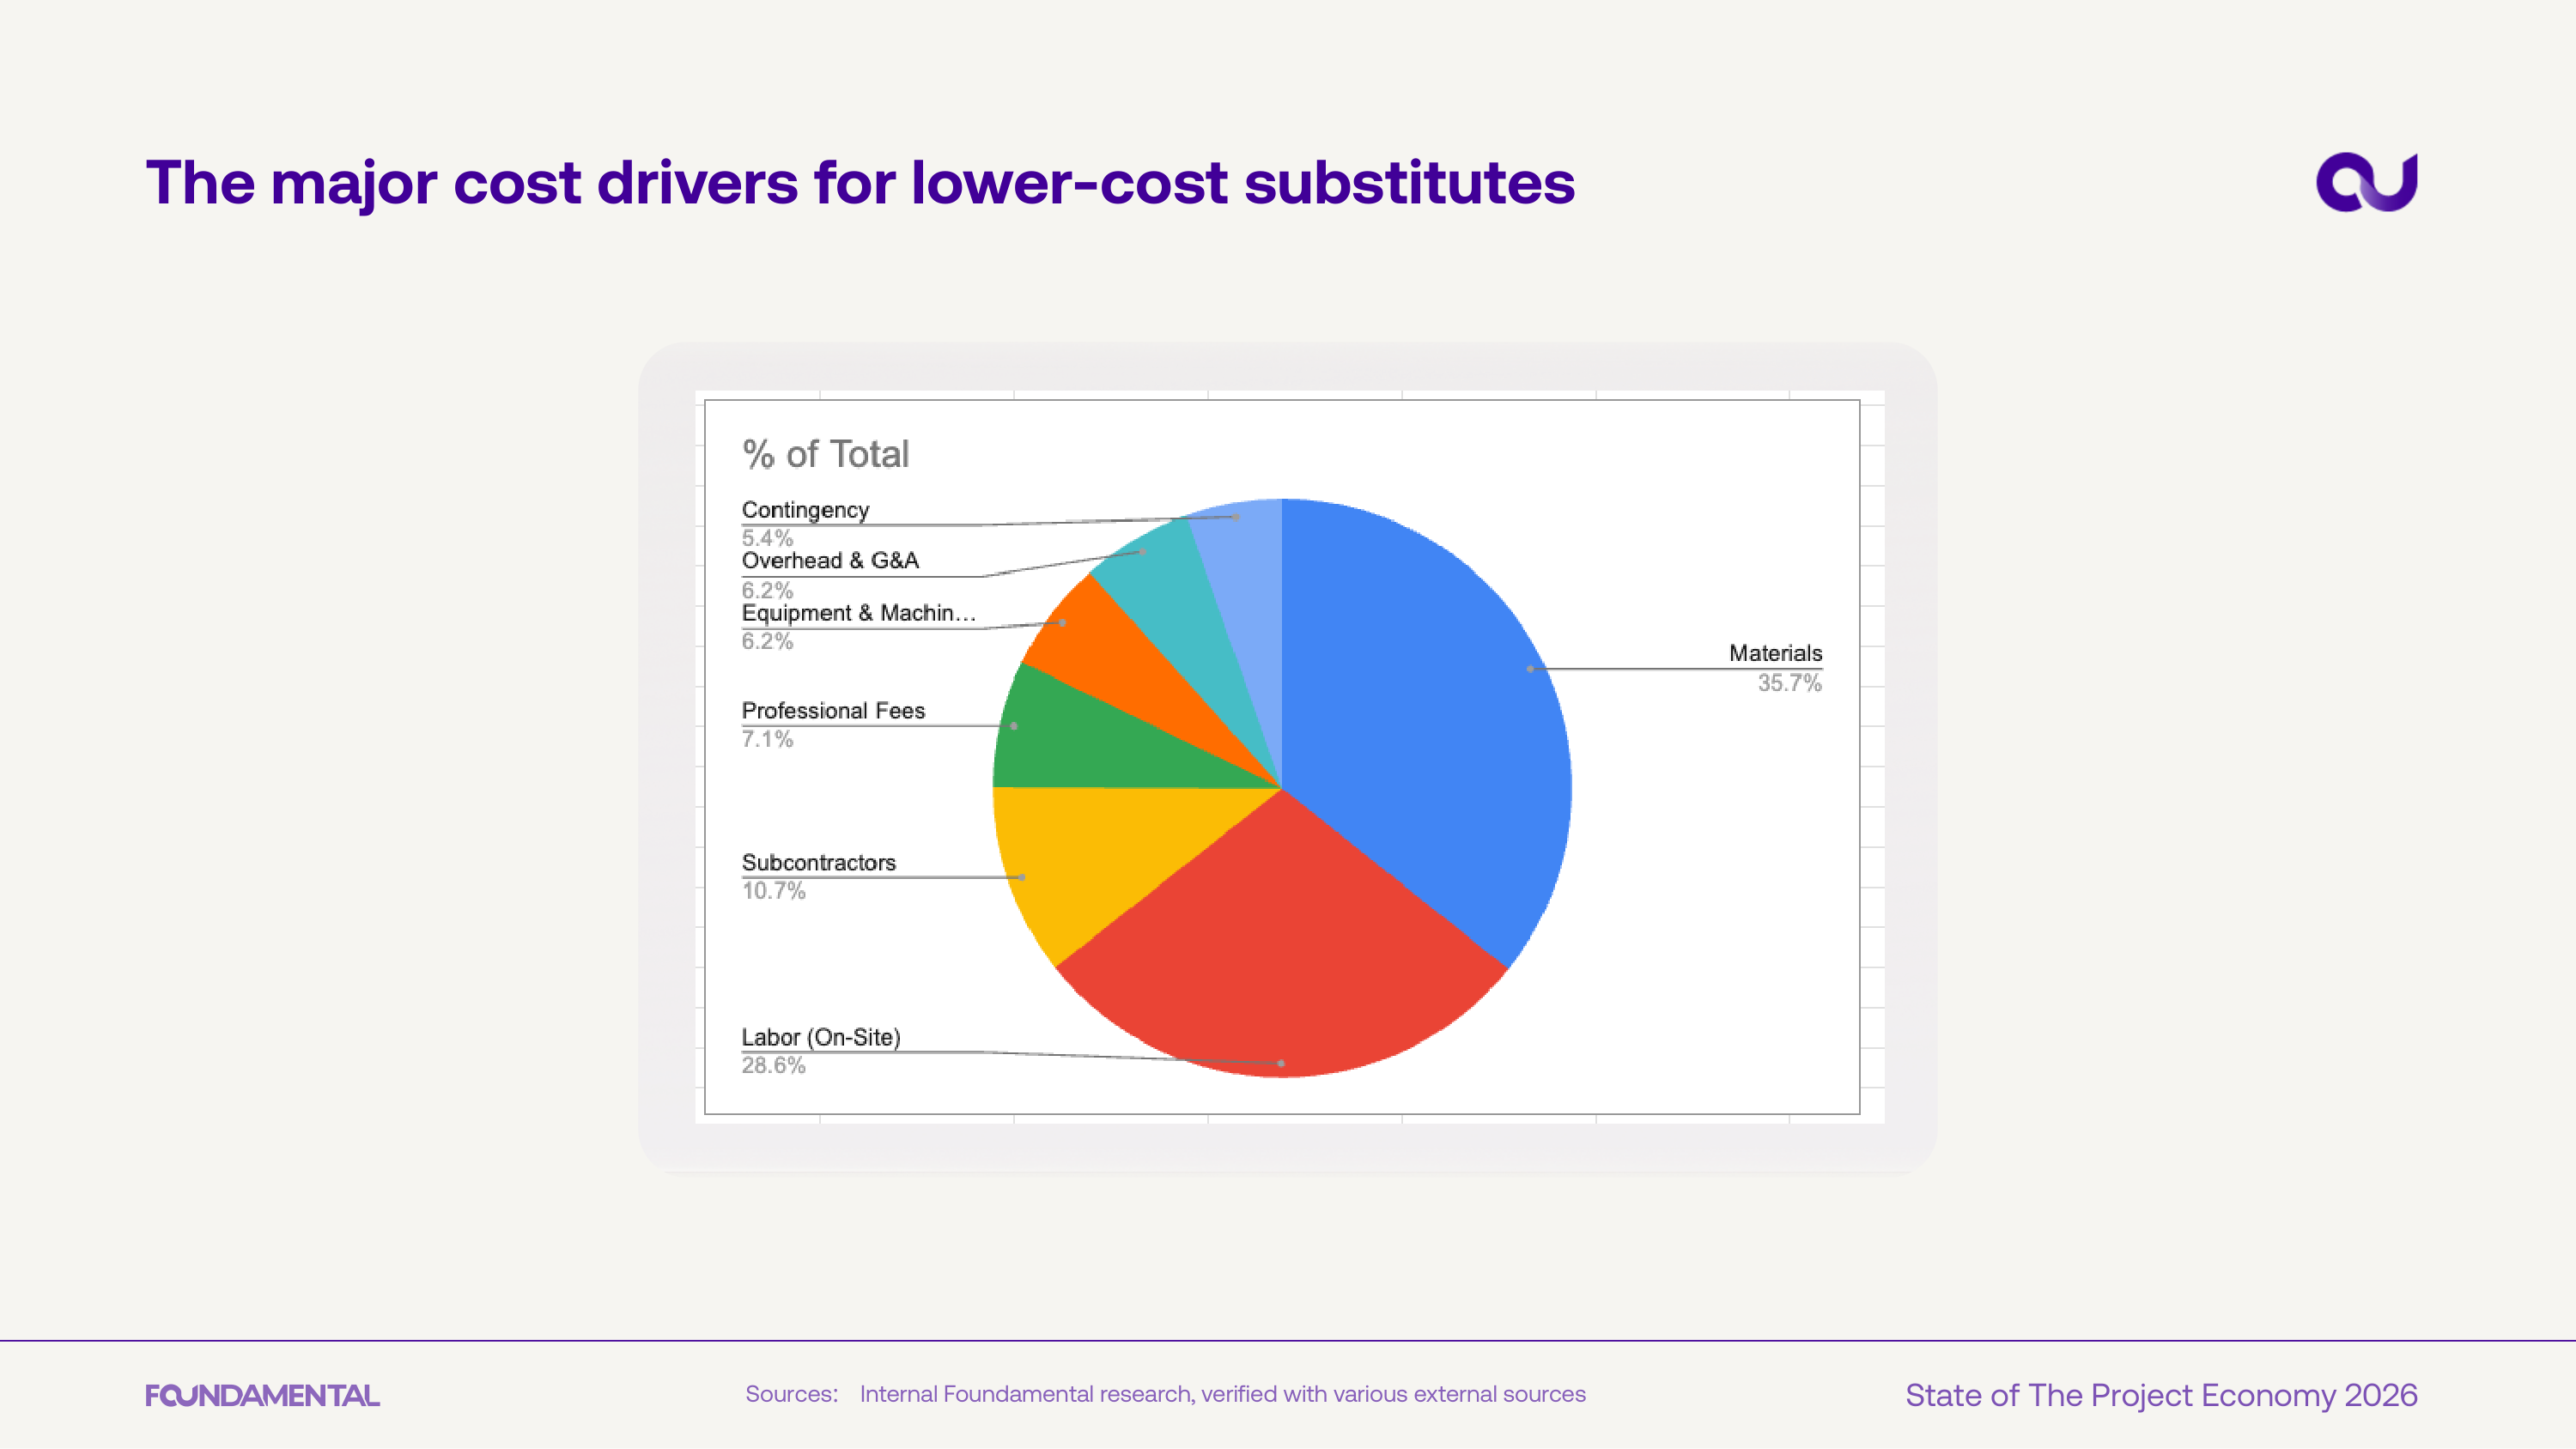
Materials (35.7%) and on-site labor (28.6%) together account for nearly two-thirds of total construction costs. These are the two largest cost levers for any low-cost substitution strategy.
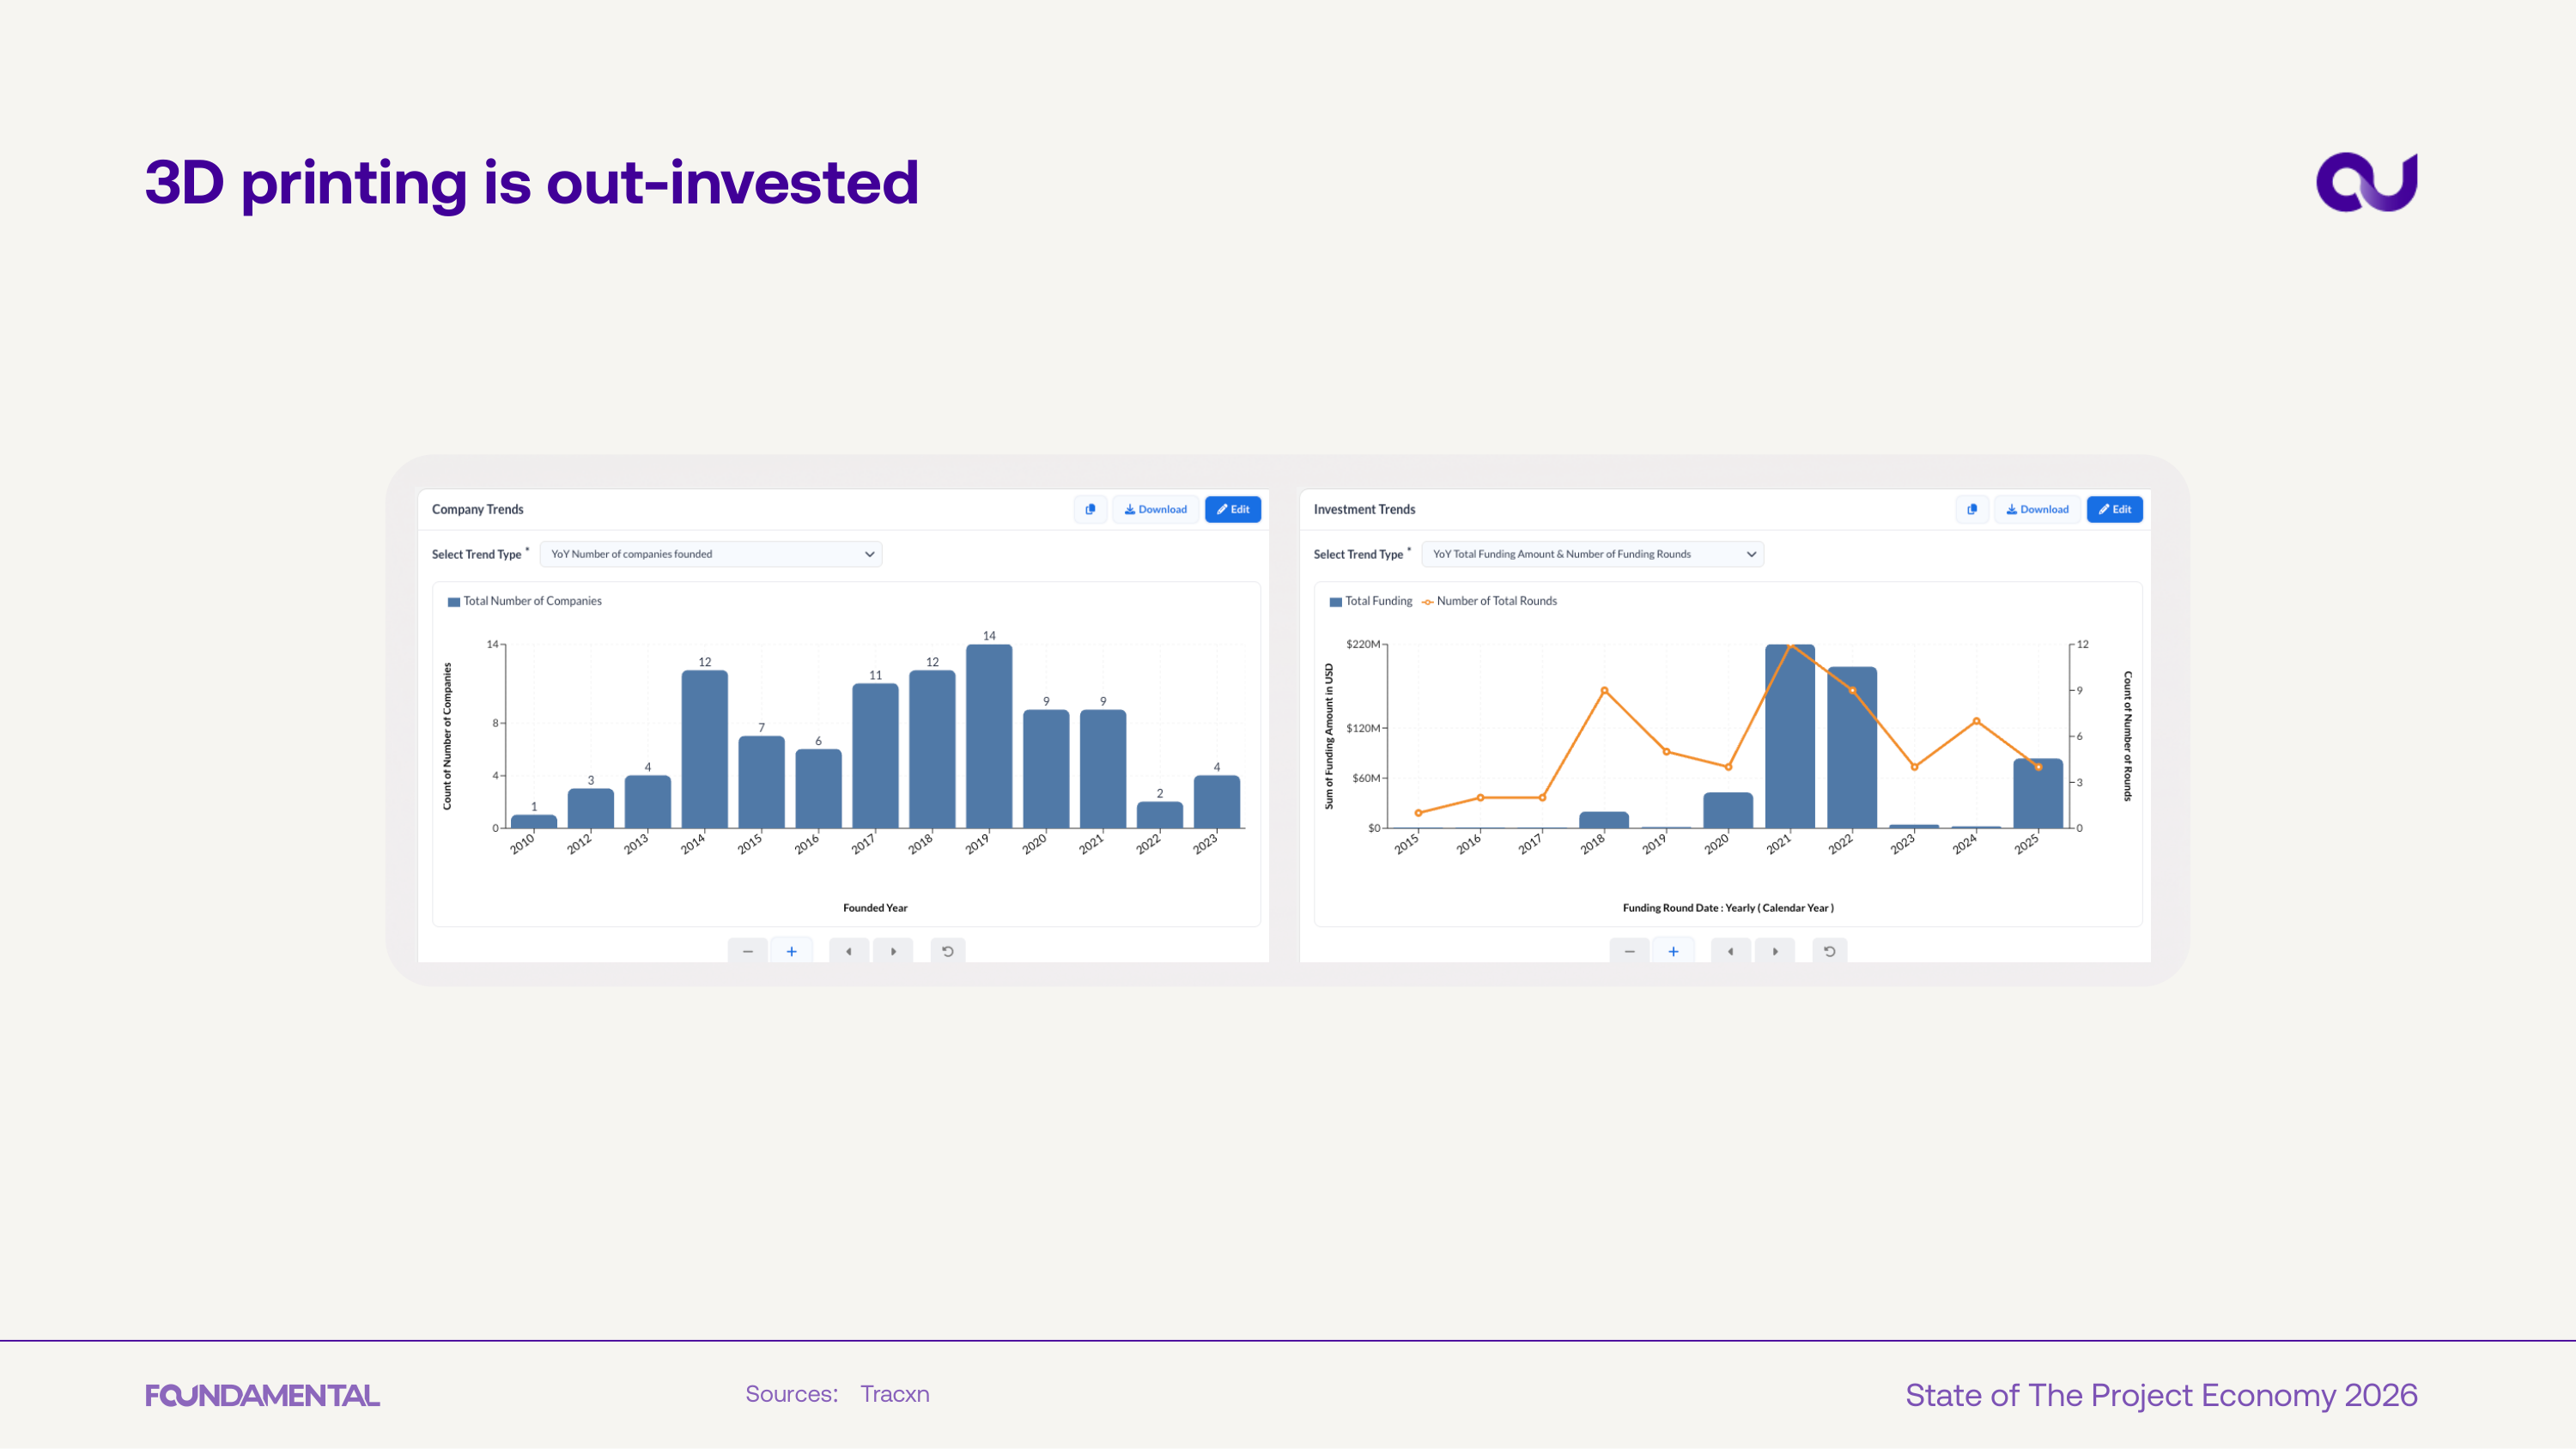
3D printing in construction saw company formation peak around 2017-2018, with founding activity declining since. Investment has remained volatile, suggesting the technology hasn't found consistent product-market fit.
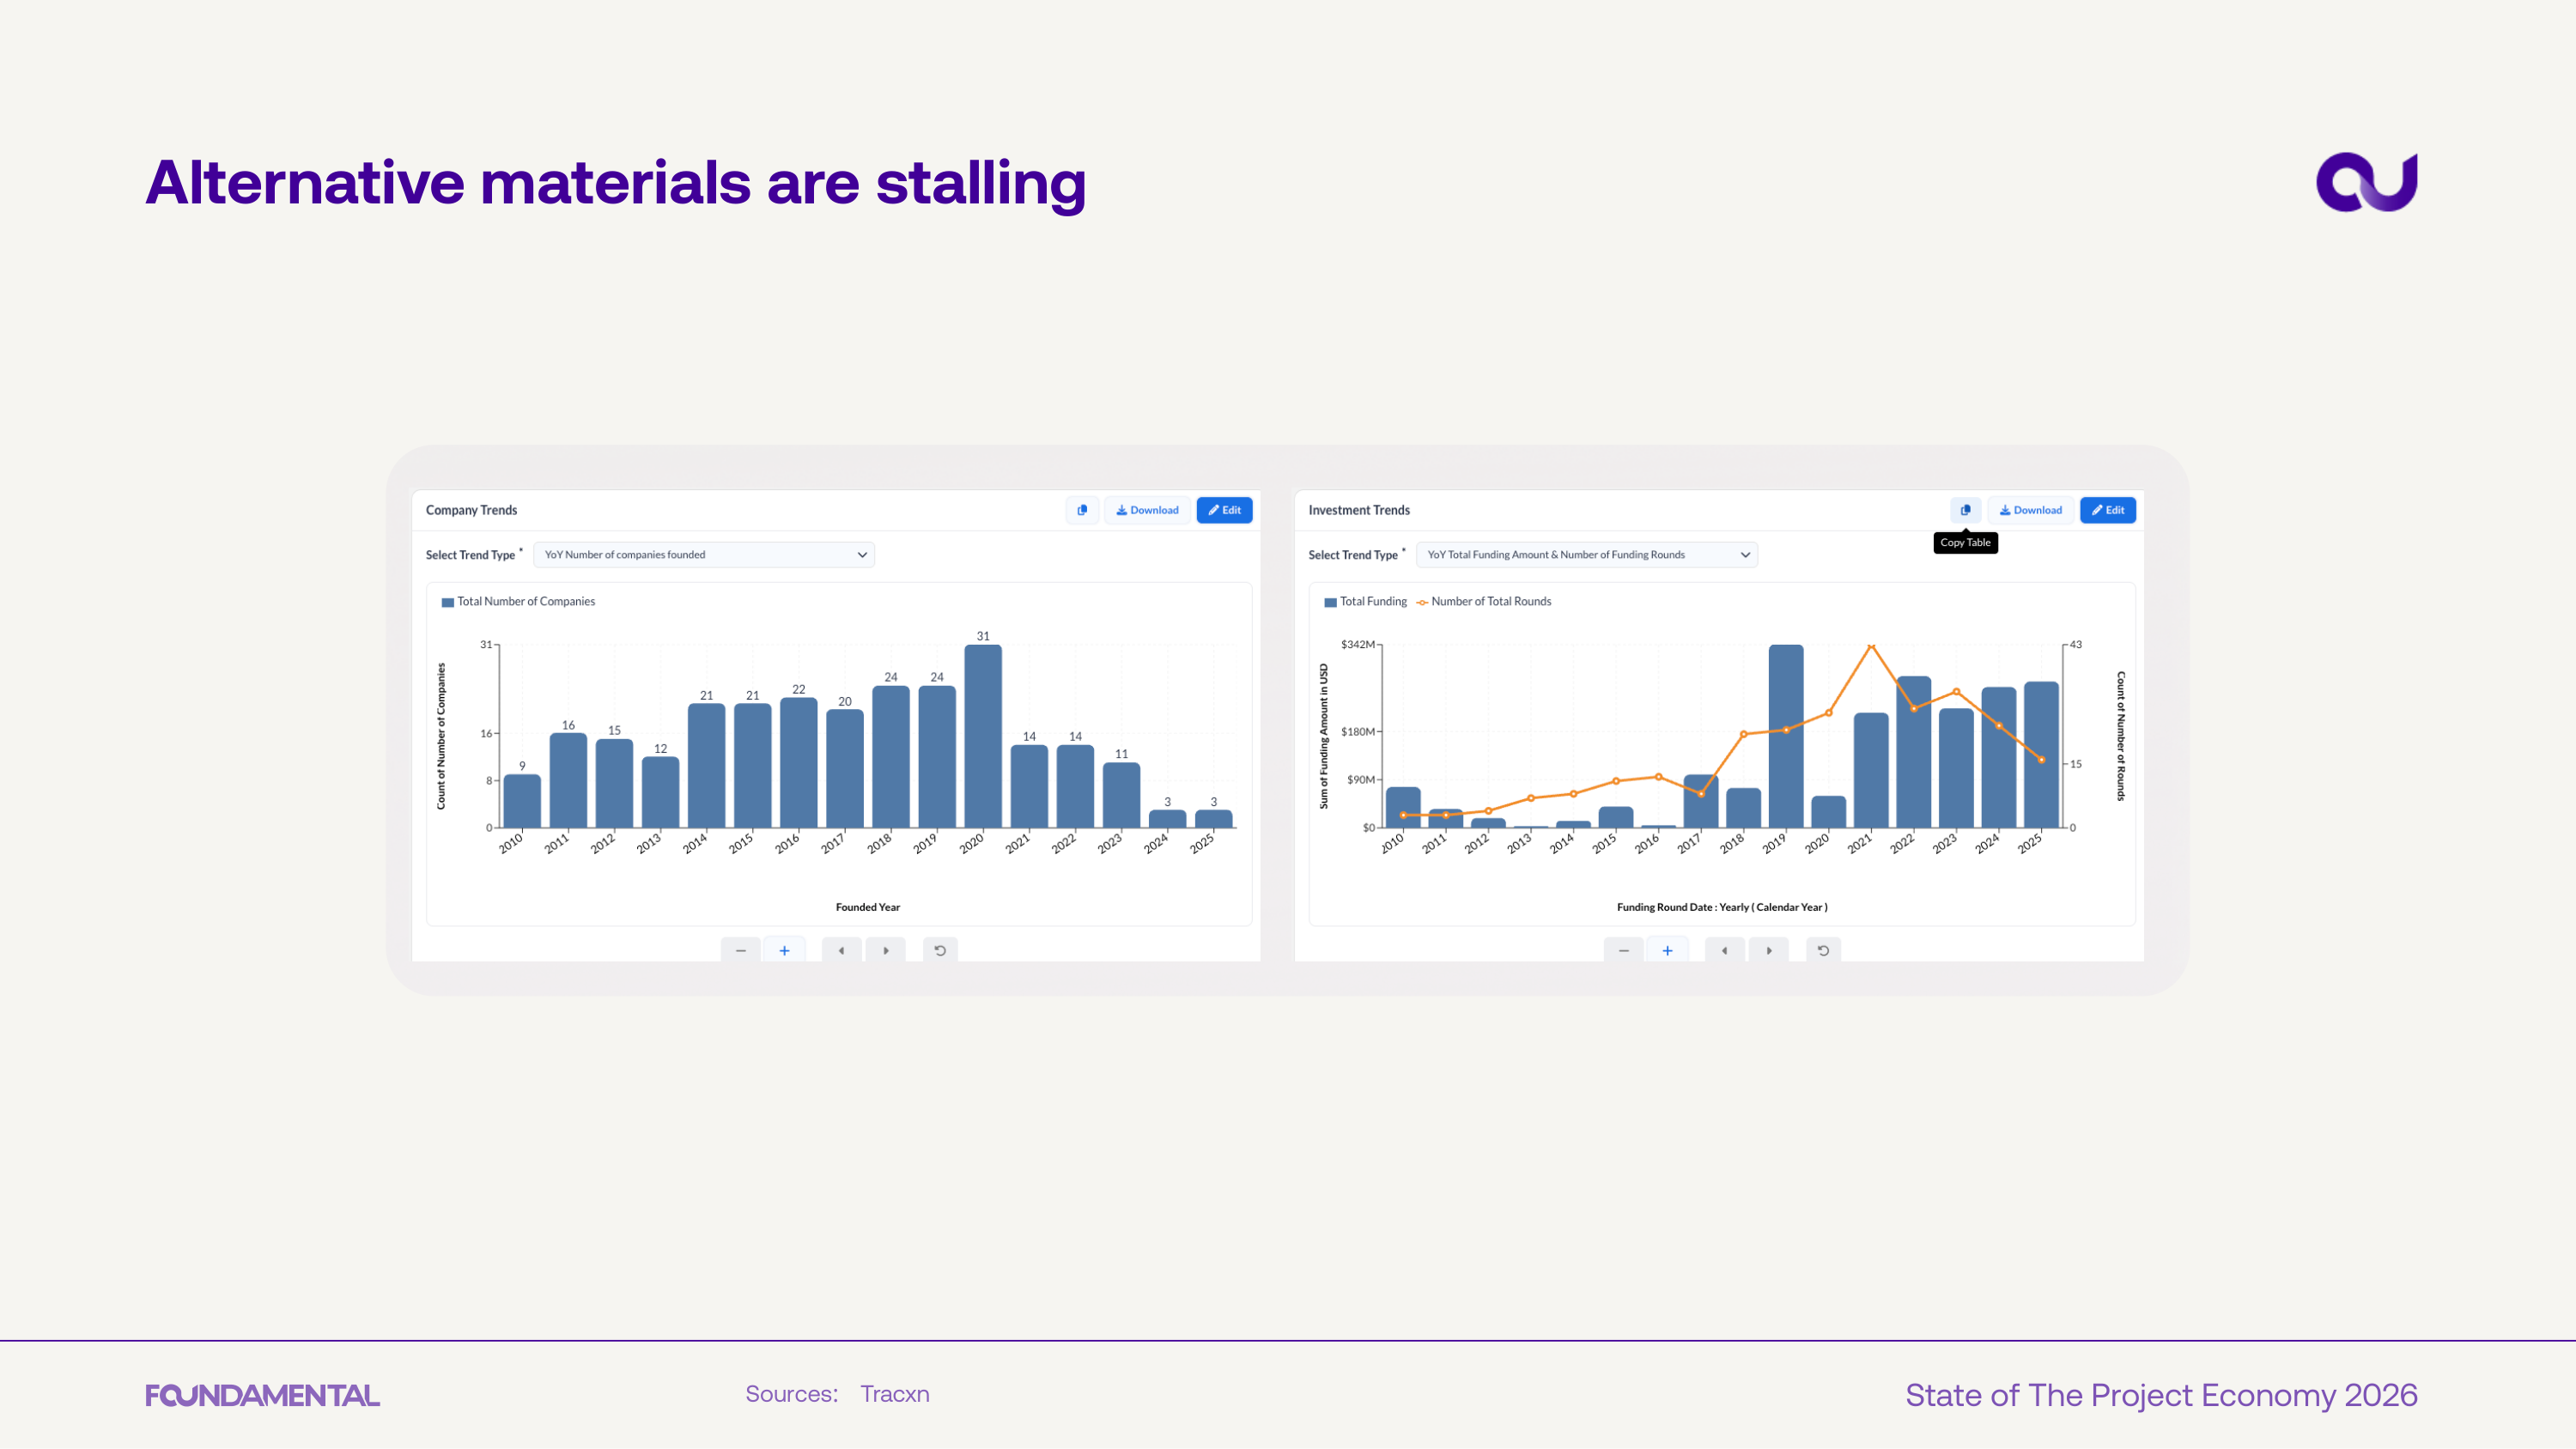
Alternative construction materials show a similar pattern - company formation peaked and is now declining, while investment remains sporadic. The sector has yet to produce a breakout category winner.
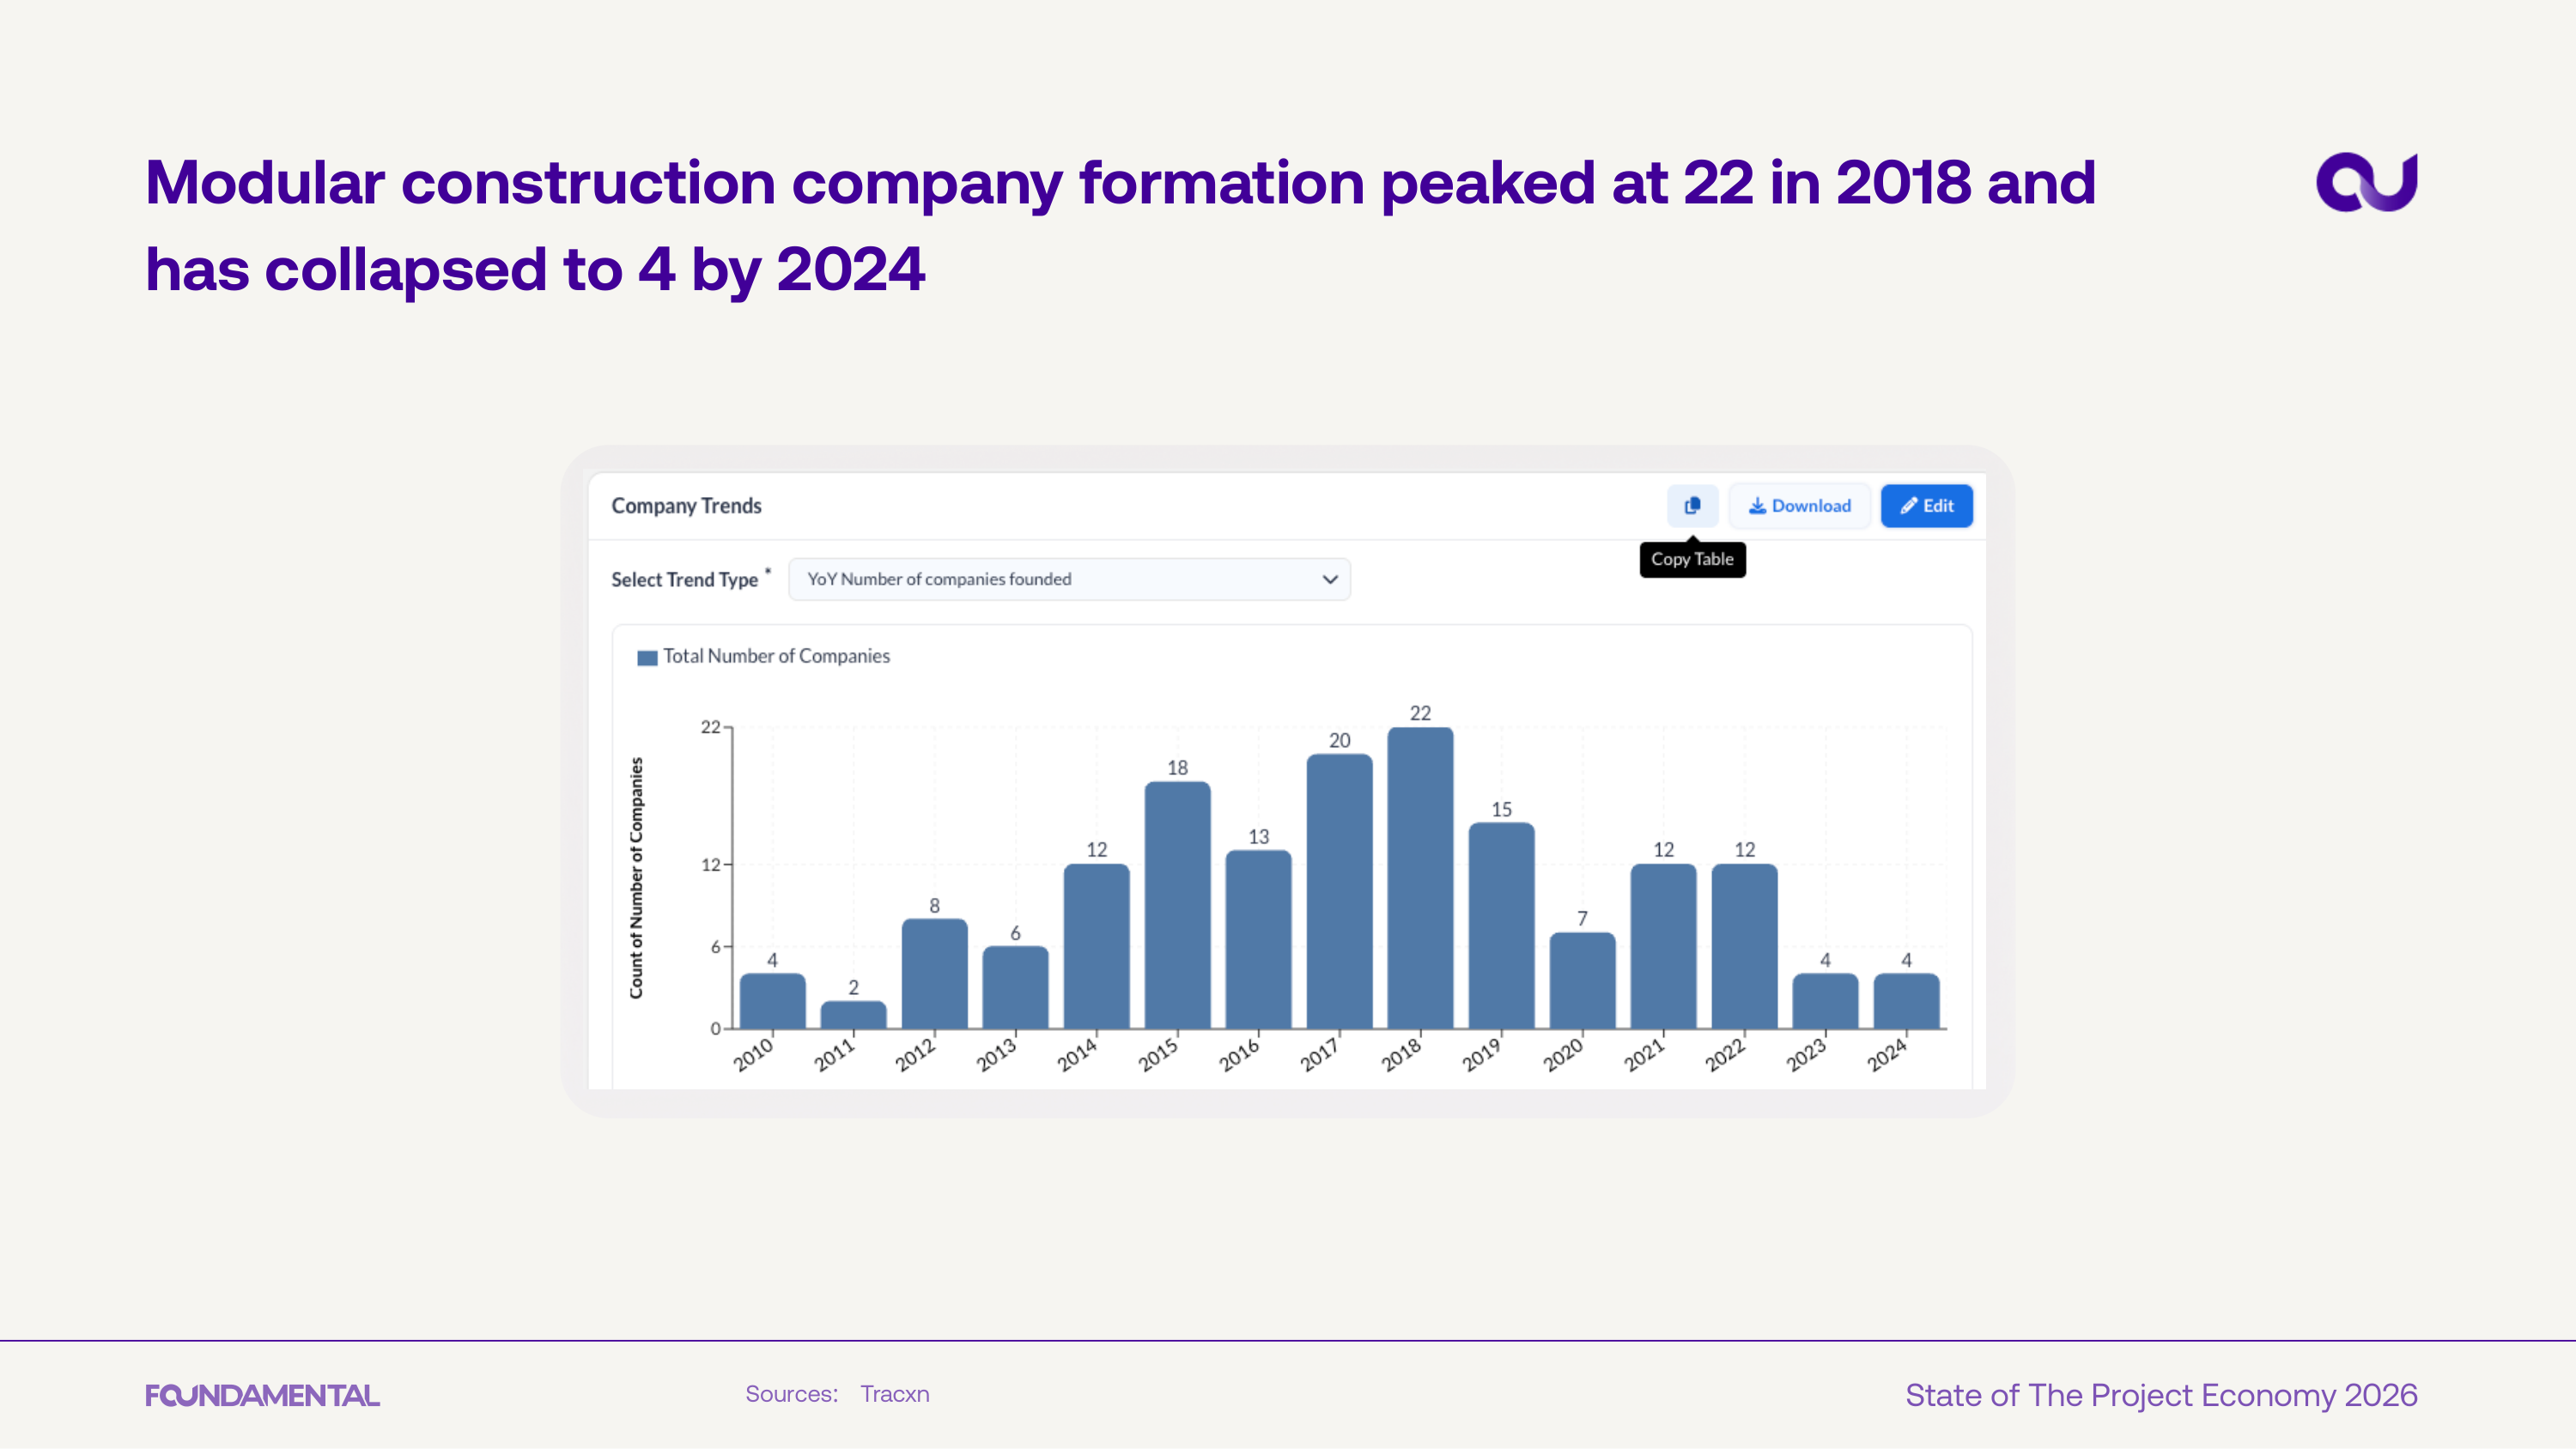
Modular construction company formation peaked at 22 in 2018 and has collapsed to just 4 by 2024. After a wave of hype and capital, the sector is experiencing a hard reset as unit economics proved harder to crack than expected.
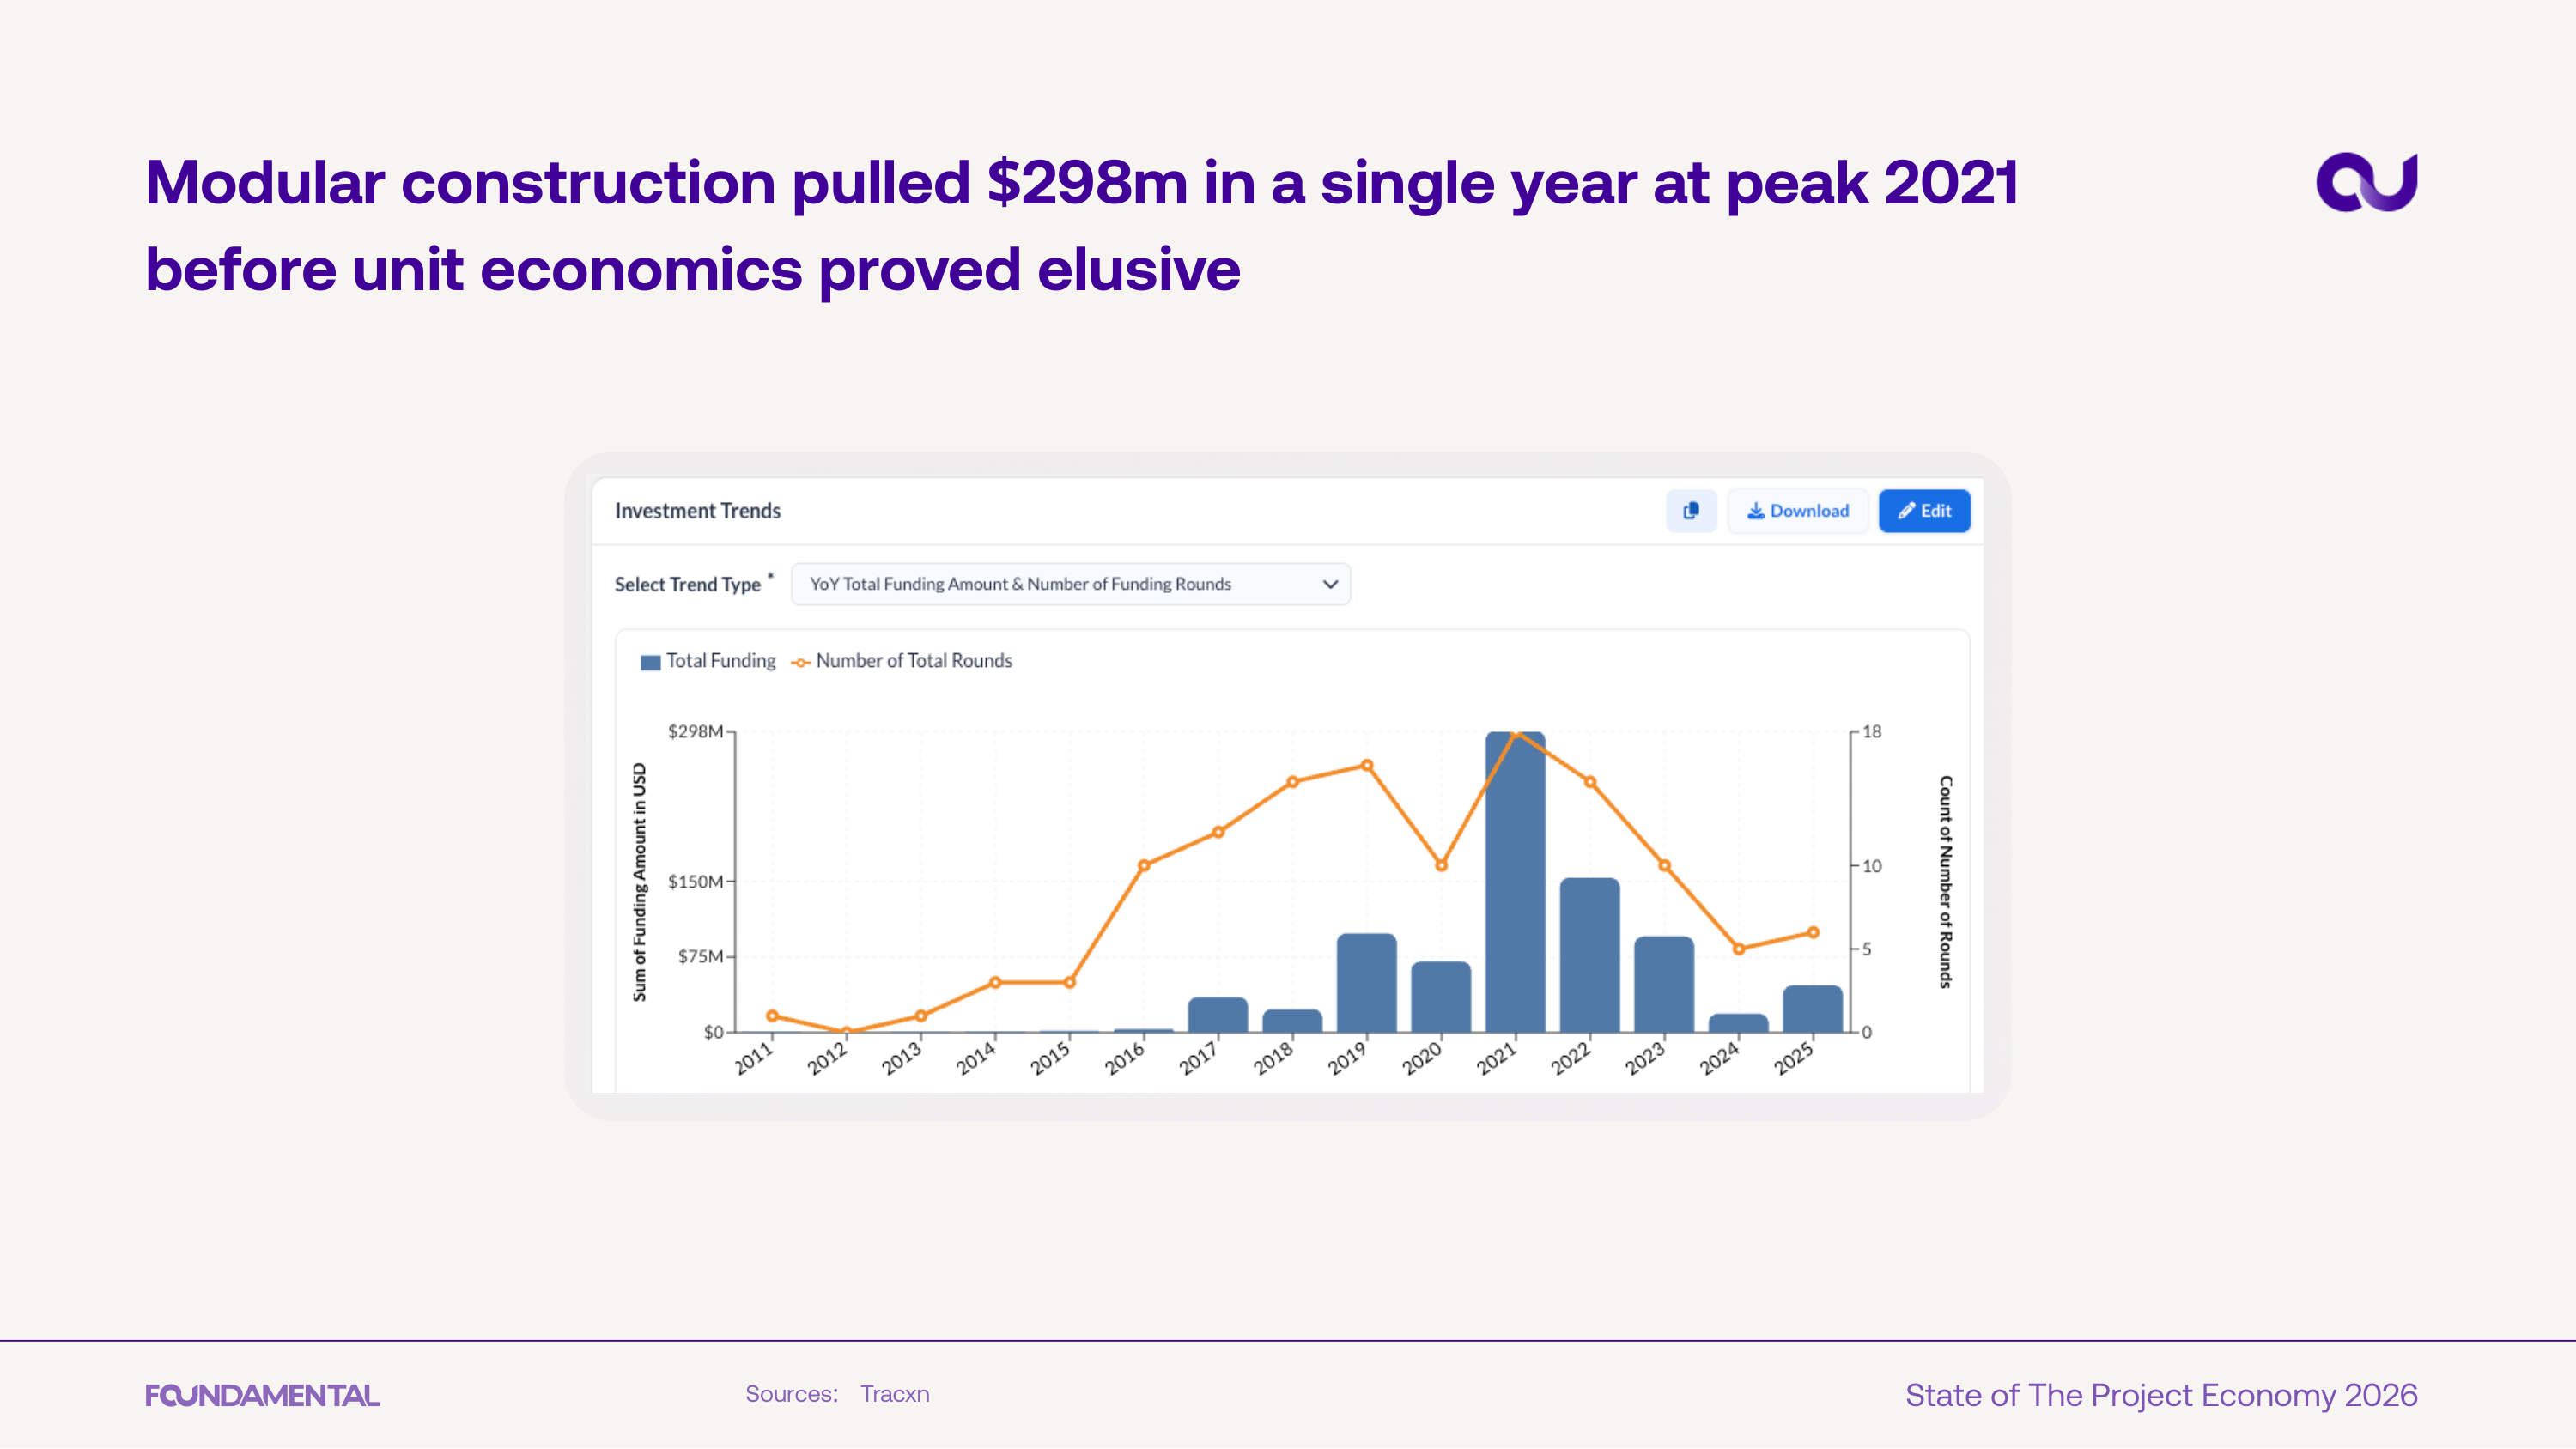
Modular construction funding hit $298M in a single year at its 2021 peak before collapsing. The funding decline mirrors the drop in new company formation, signaling a full-sector correction.
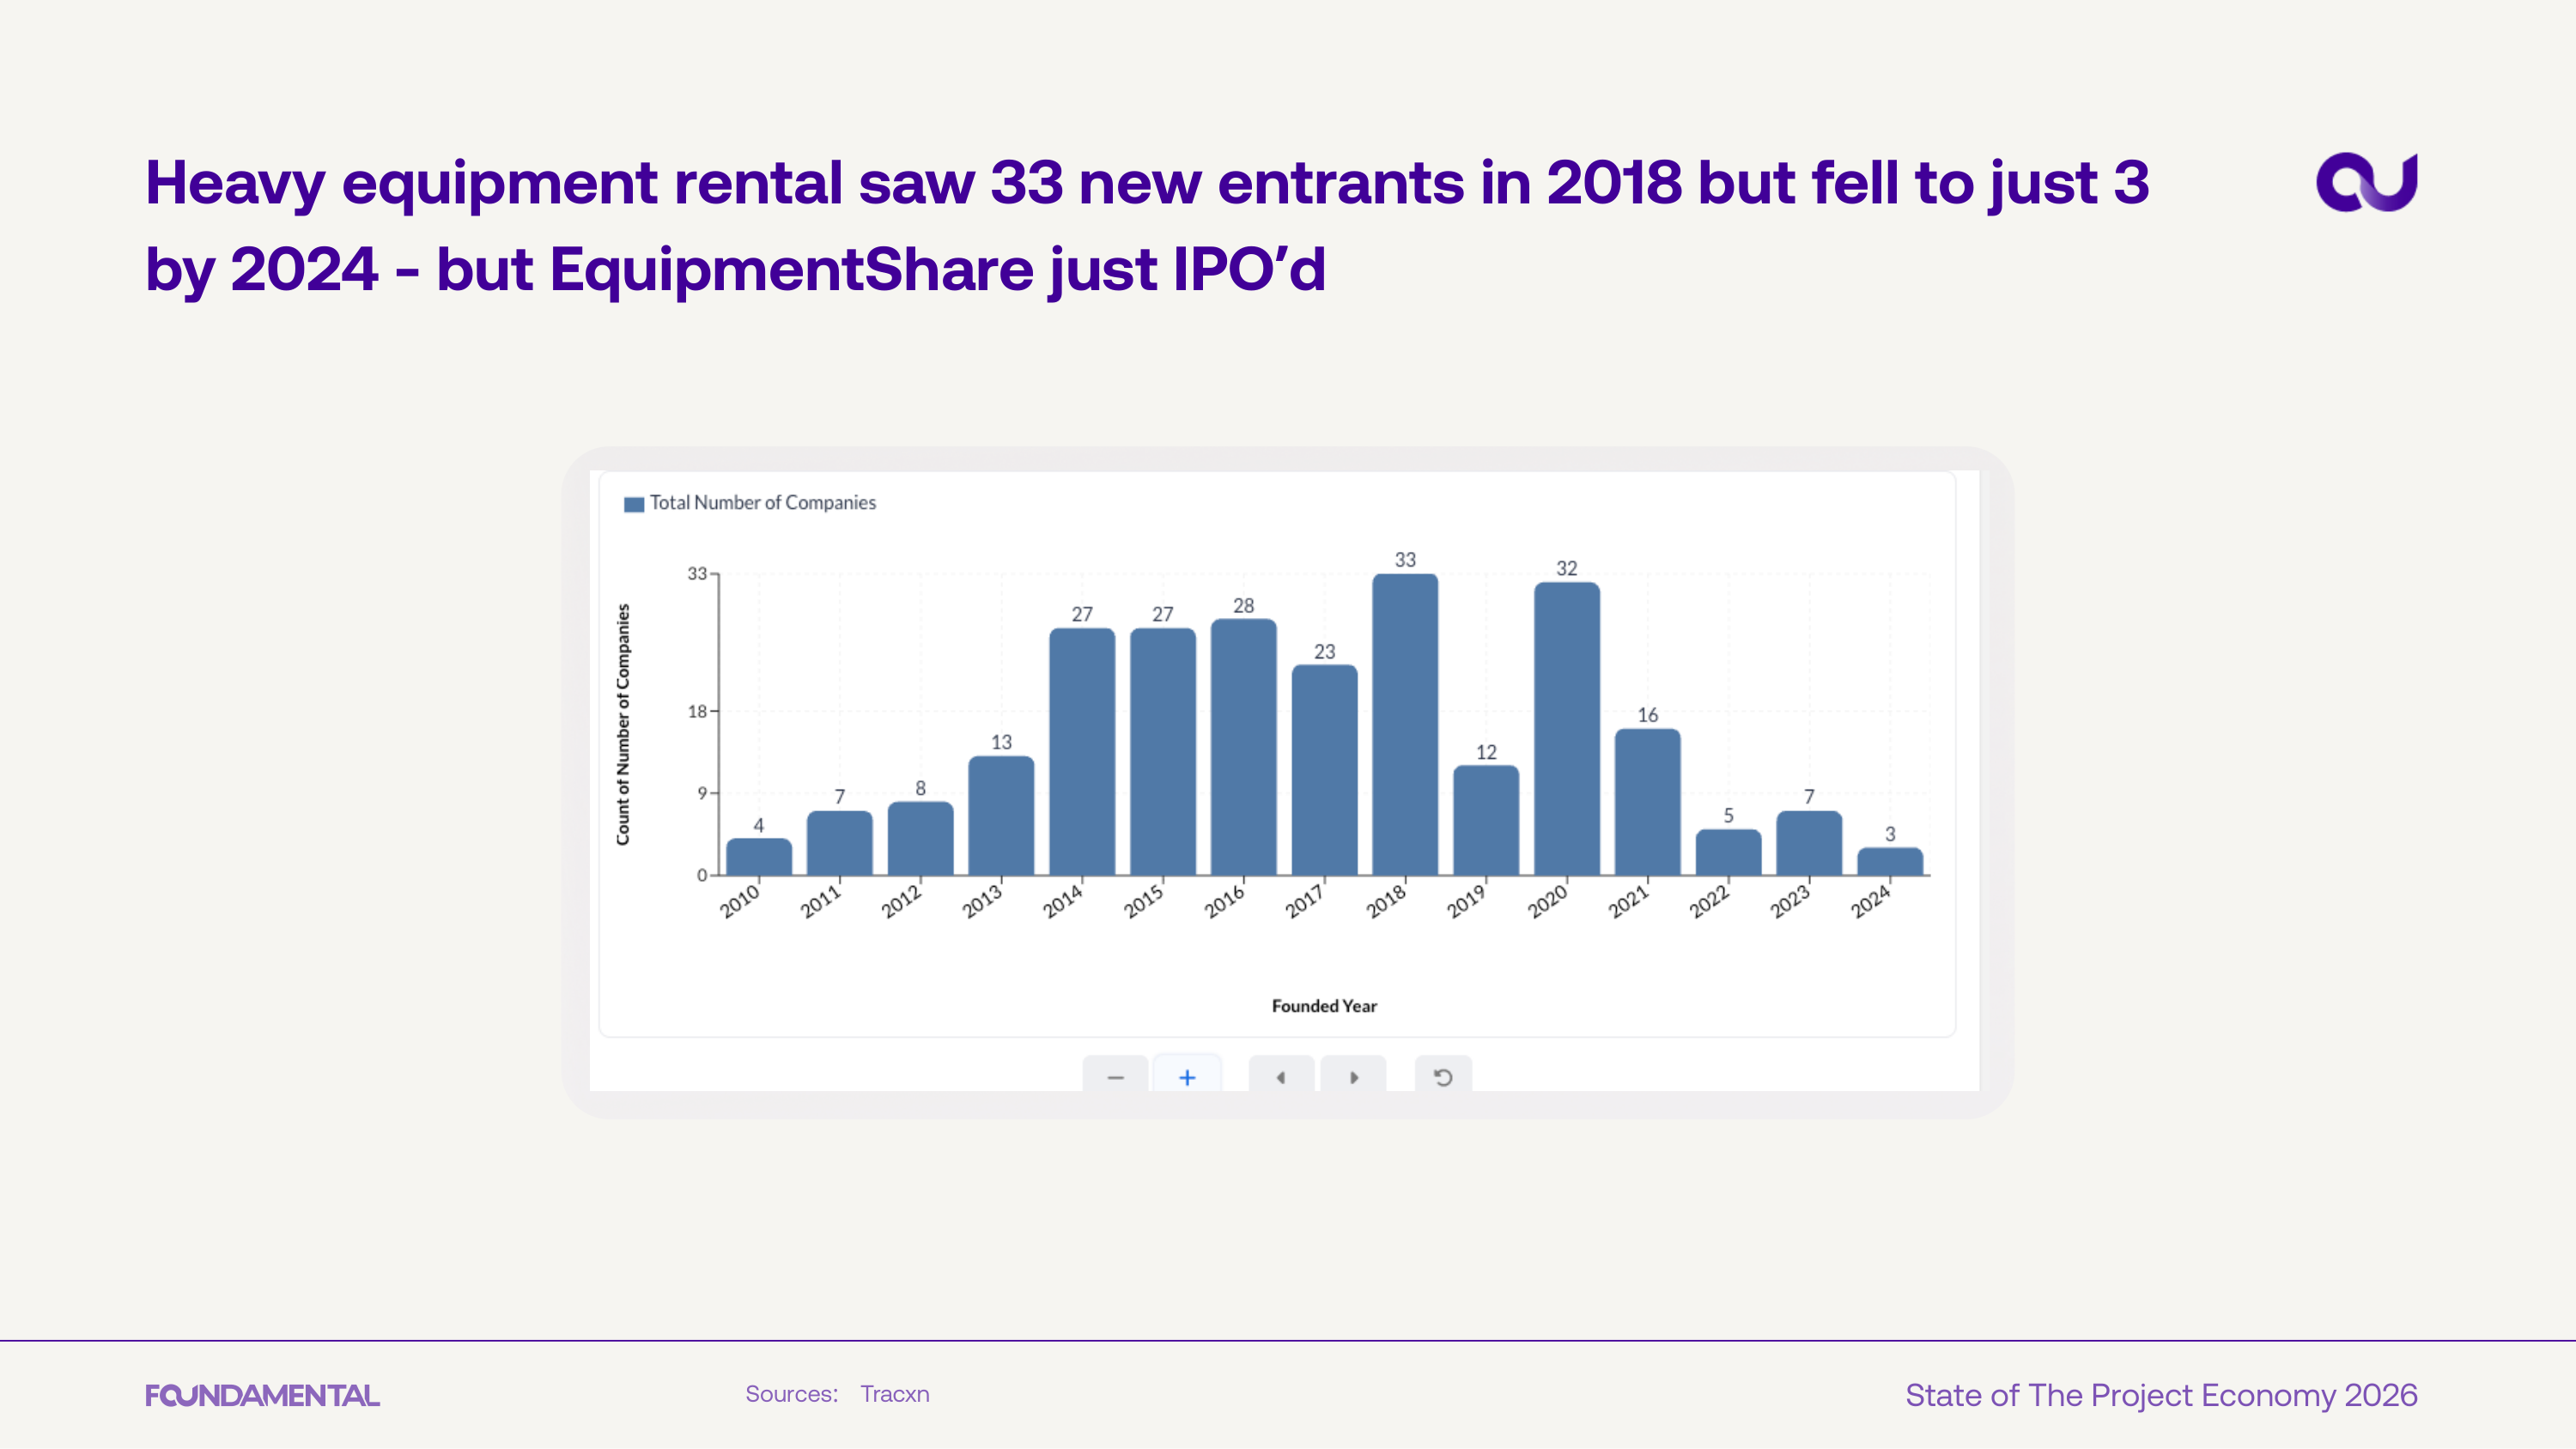
Heavy equipment rental saw 33 new entrants in 2018, falling to just 3 by 2024. Despite the slowdown, EquipmentShare's recent IPO shows the category can still produce defining outcomes.
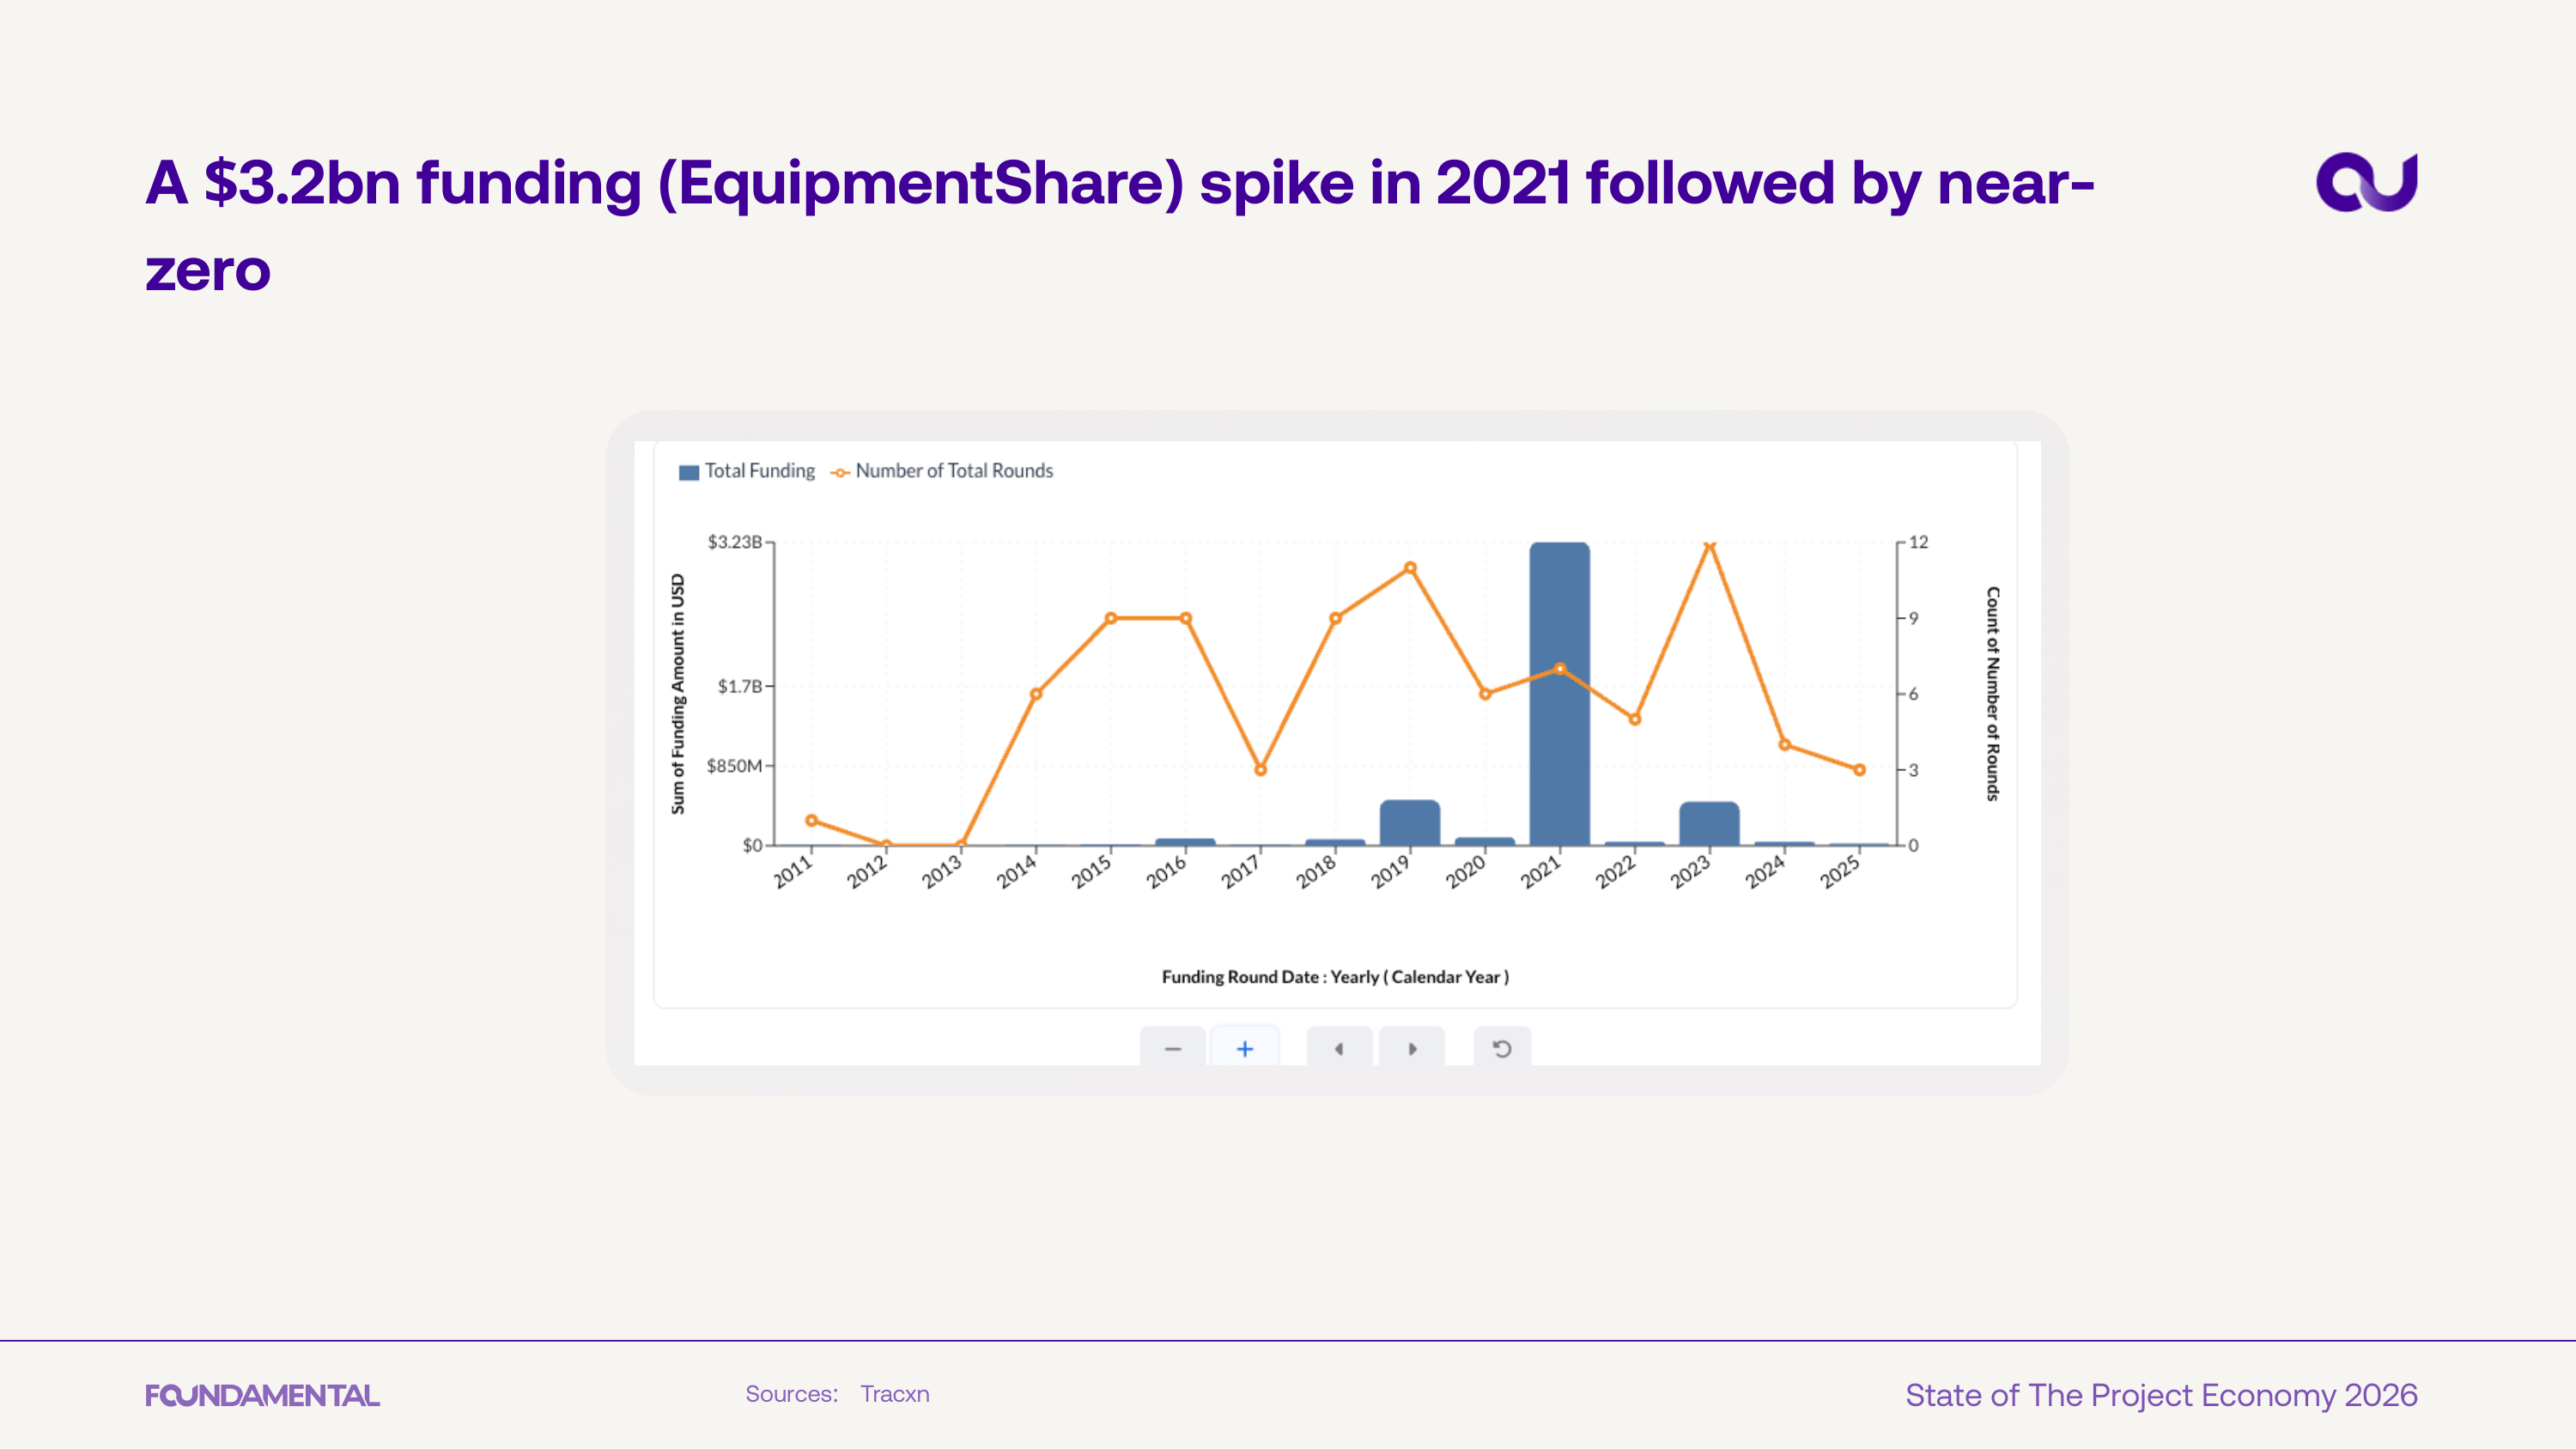
Equipment rental funding spiked to $3.2B in 2021, driven largely by EquipmentShare, then dropped to near-zero. The pattern reflects a winner-take-most dynamic in a consolidating market.

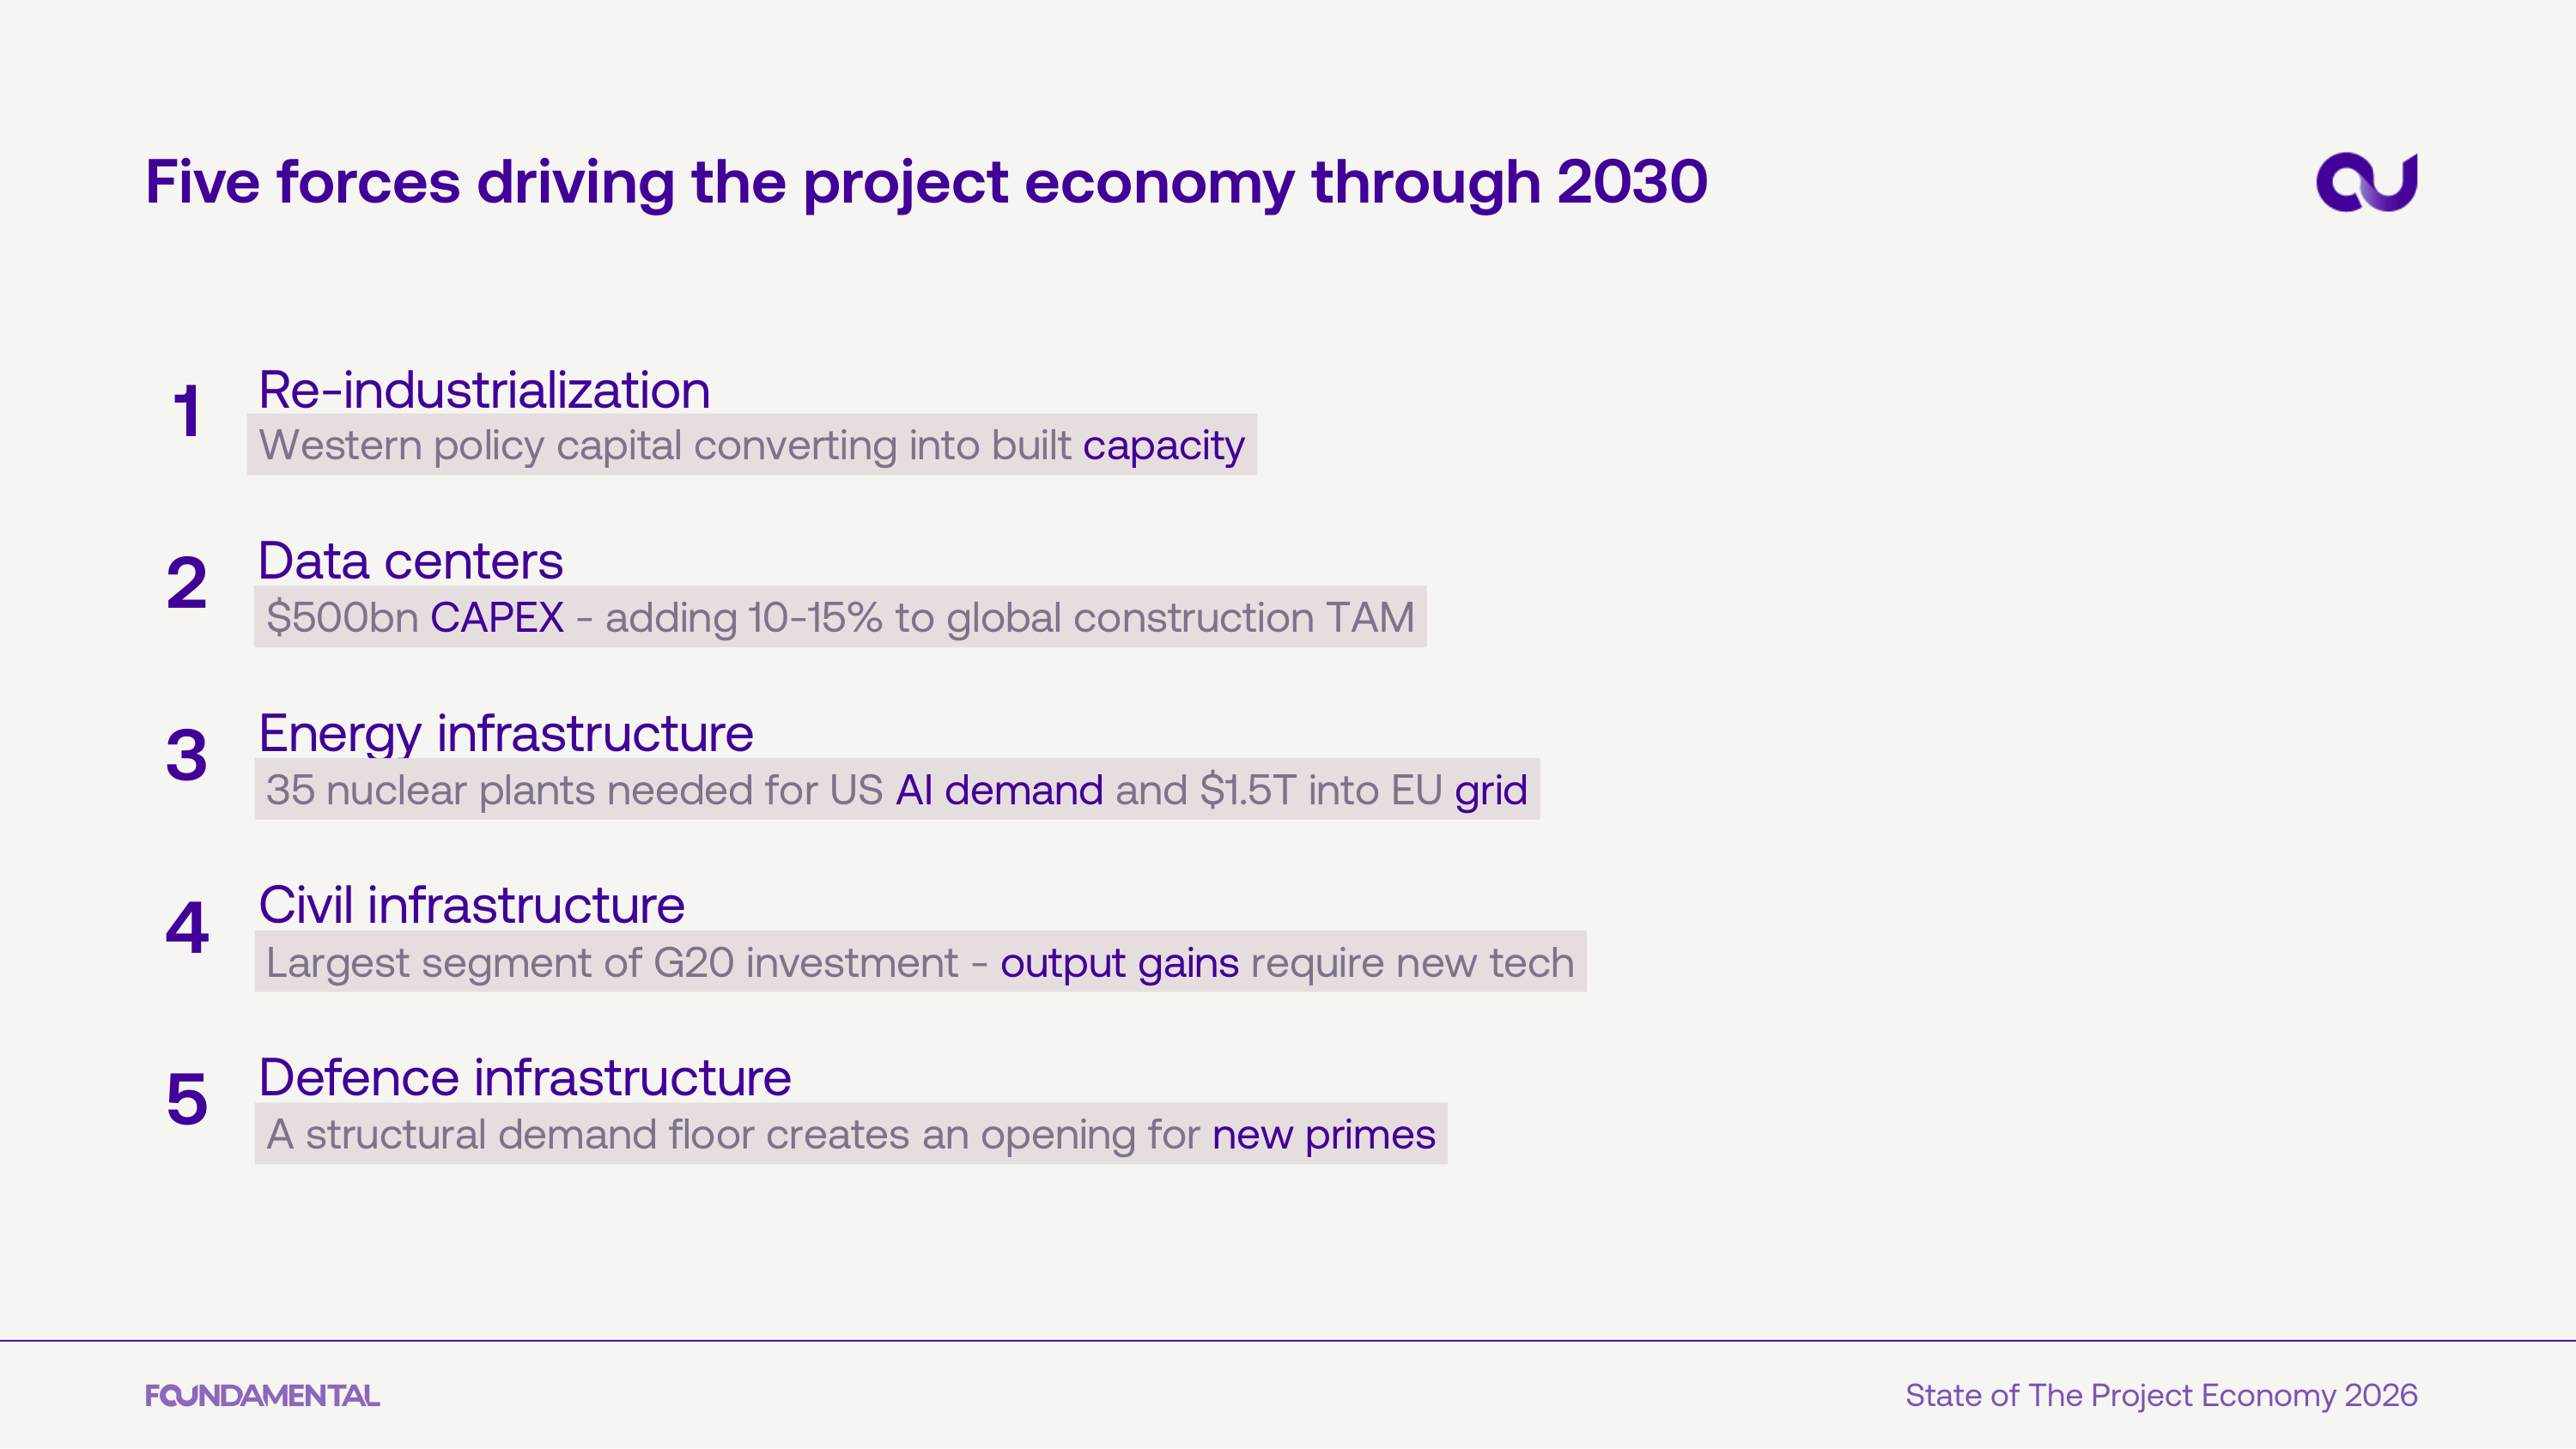
Five structural forces are reshaping the project economy through 2030: re-industrialization of the West, data center buildout ($500B CAPEX), energy infrastructure investment ($1.5T into the EU grid alone), civil infrastructure upgrades, and defense spending as a structural demand floor.
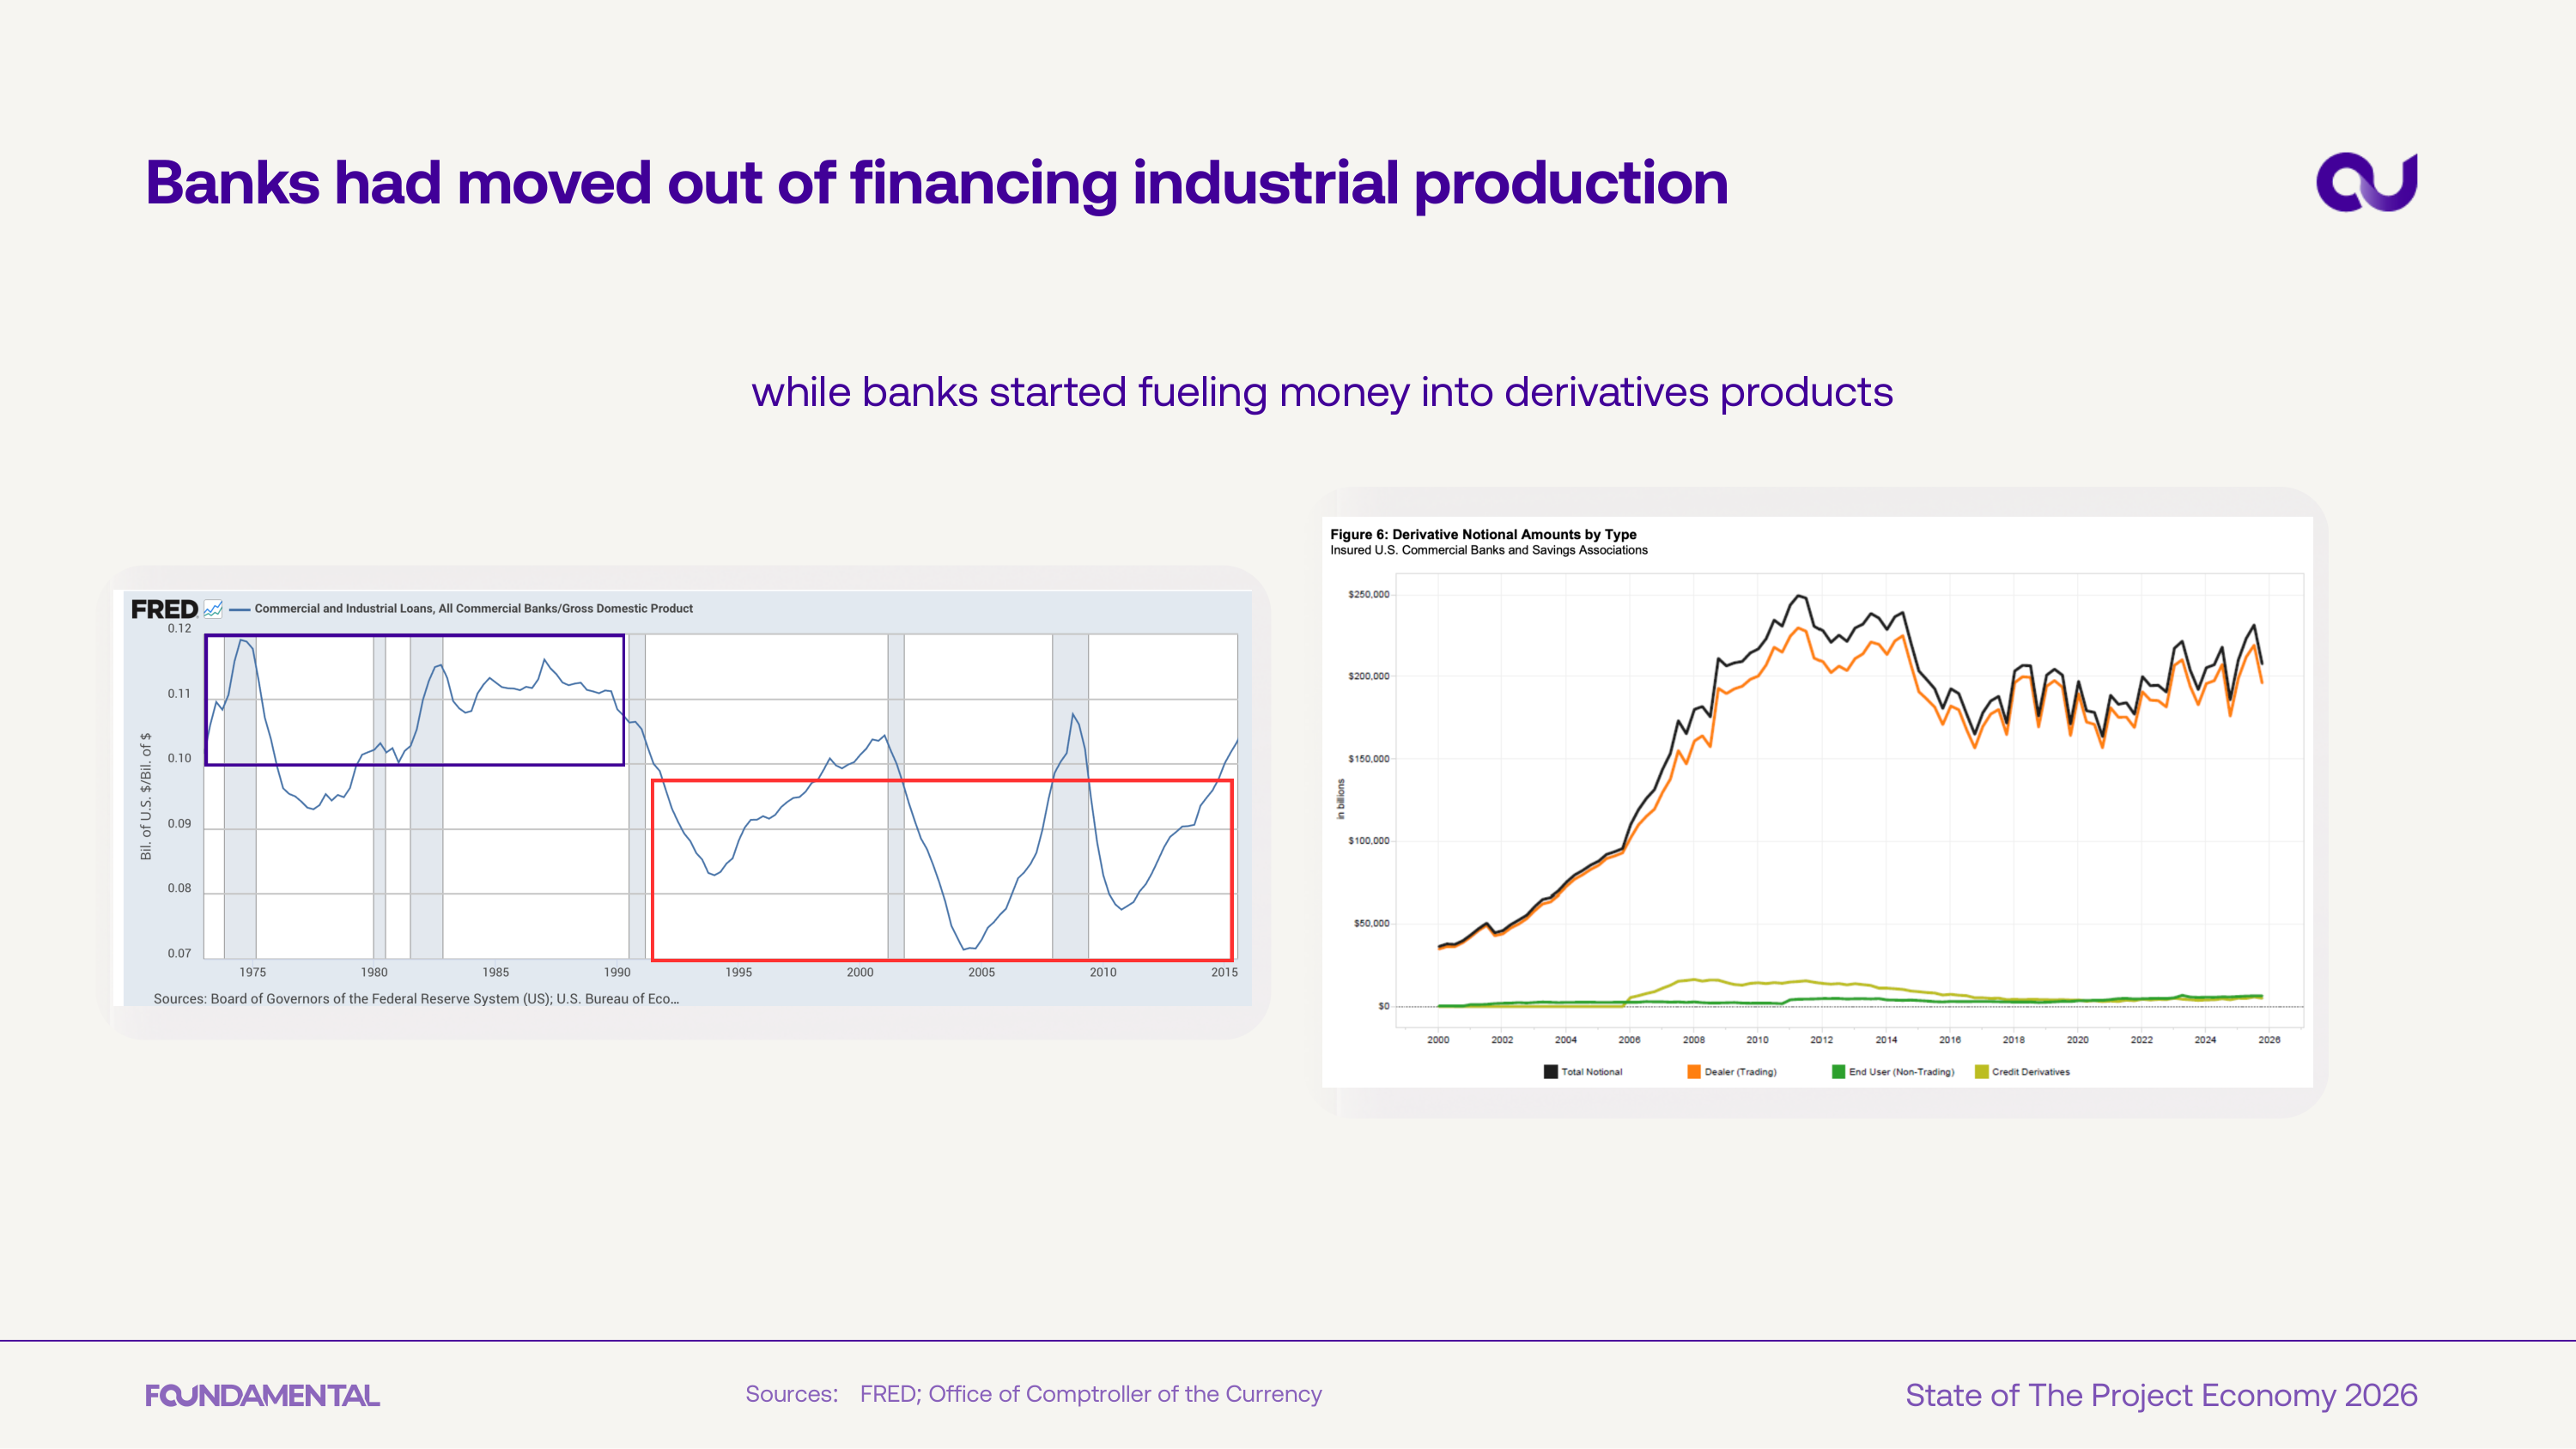
Commercial and industrial lending as a share of GDP declined for decades as banks shifted capital toward derivatives. The resulting financing gap is now being filled by policy-driven industrial spending.
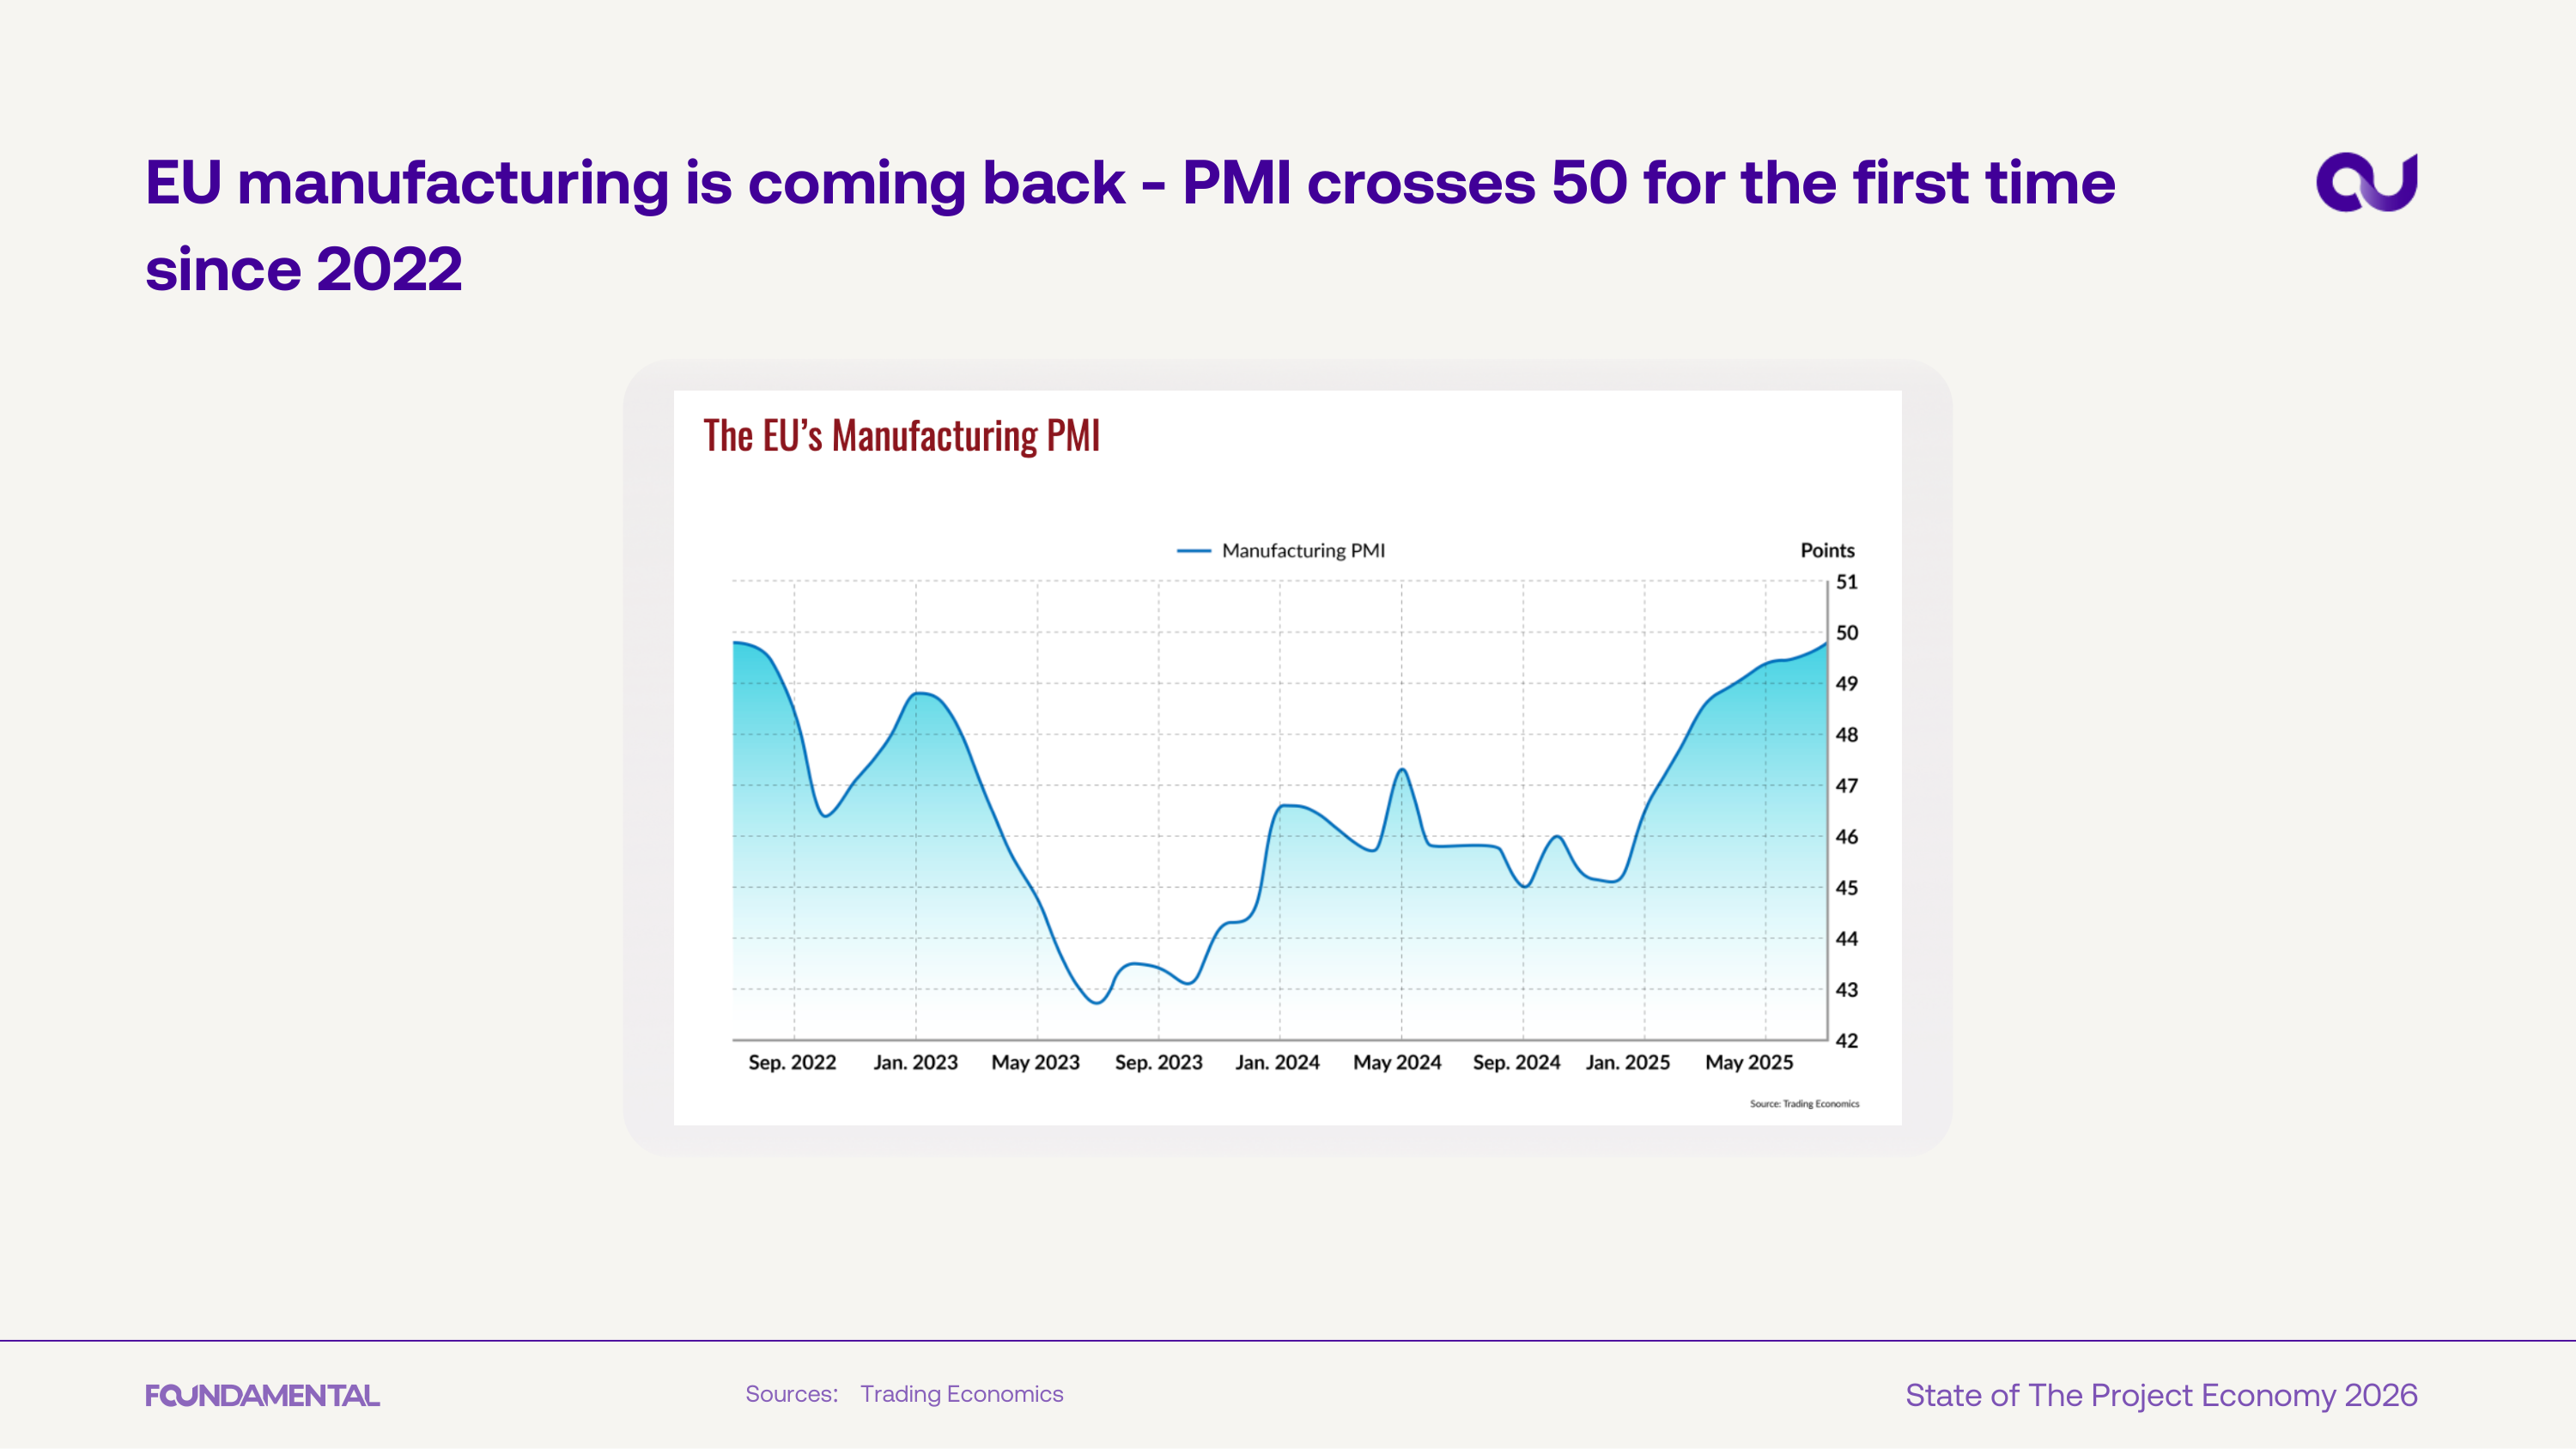
The EU Manufacturing PMI has crossed 50 for the first time since 2022, signaling a return to expansion. After nearly three years of contraction, this is a leading indicator that European industrial activity is recovering.
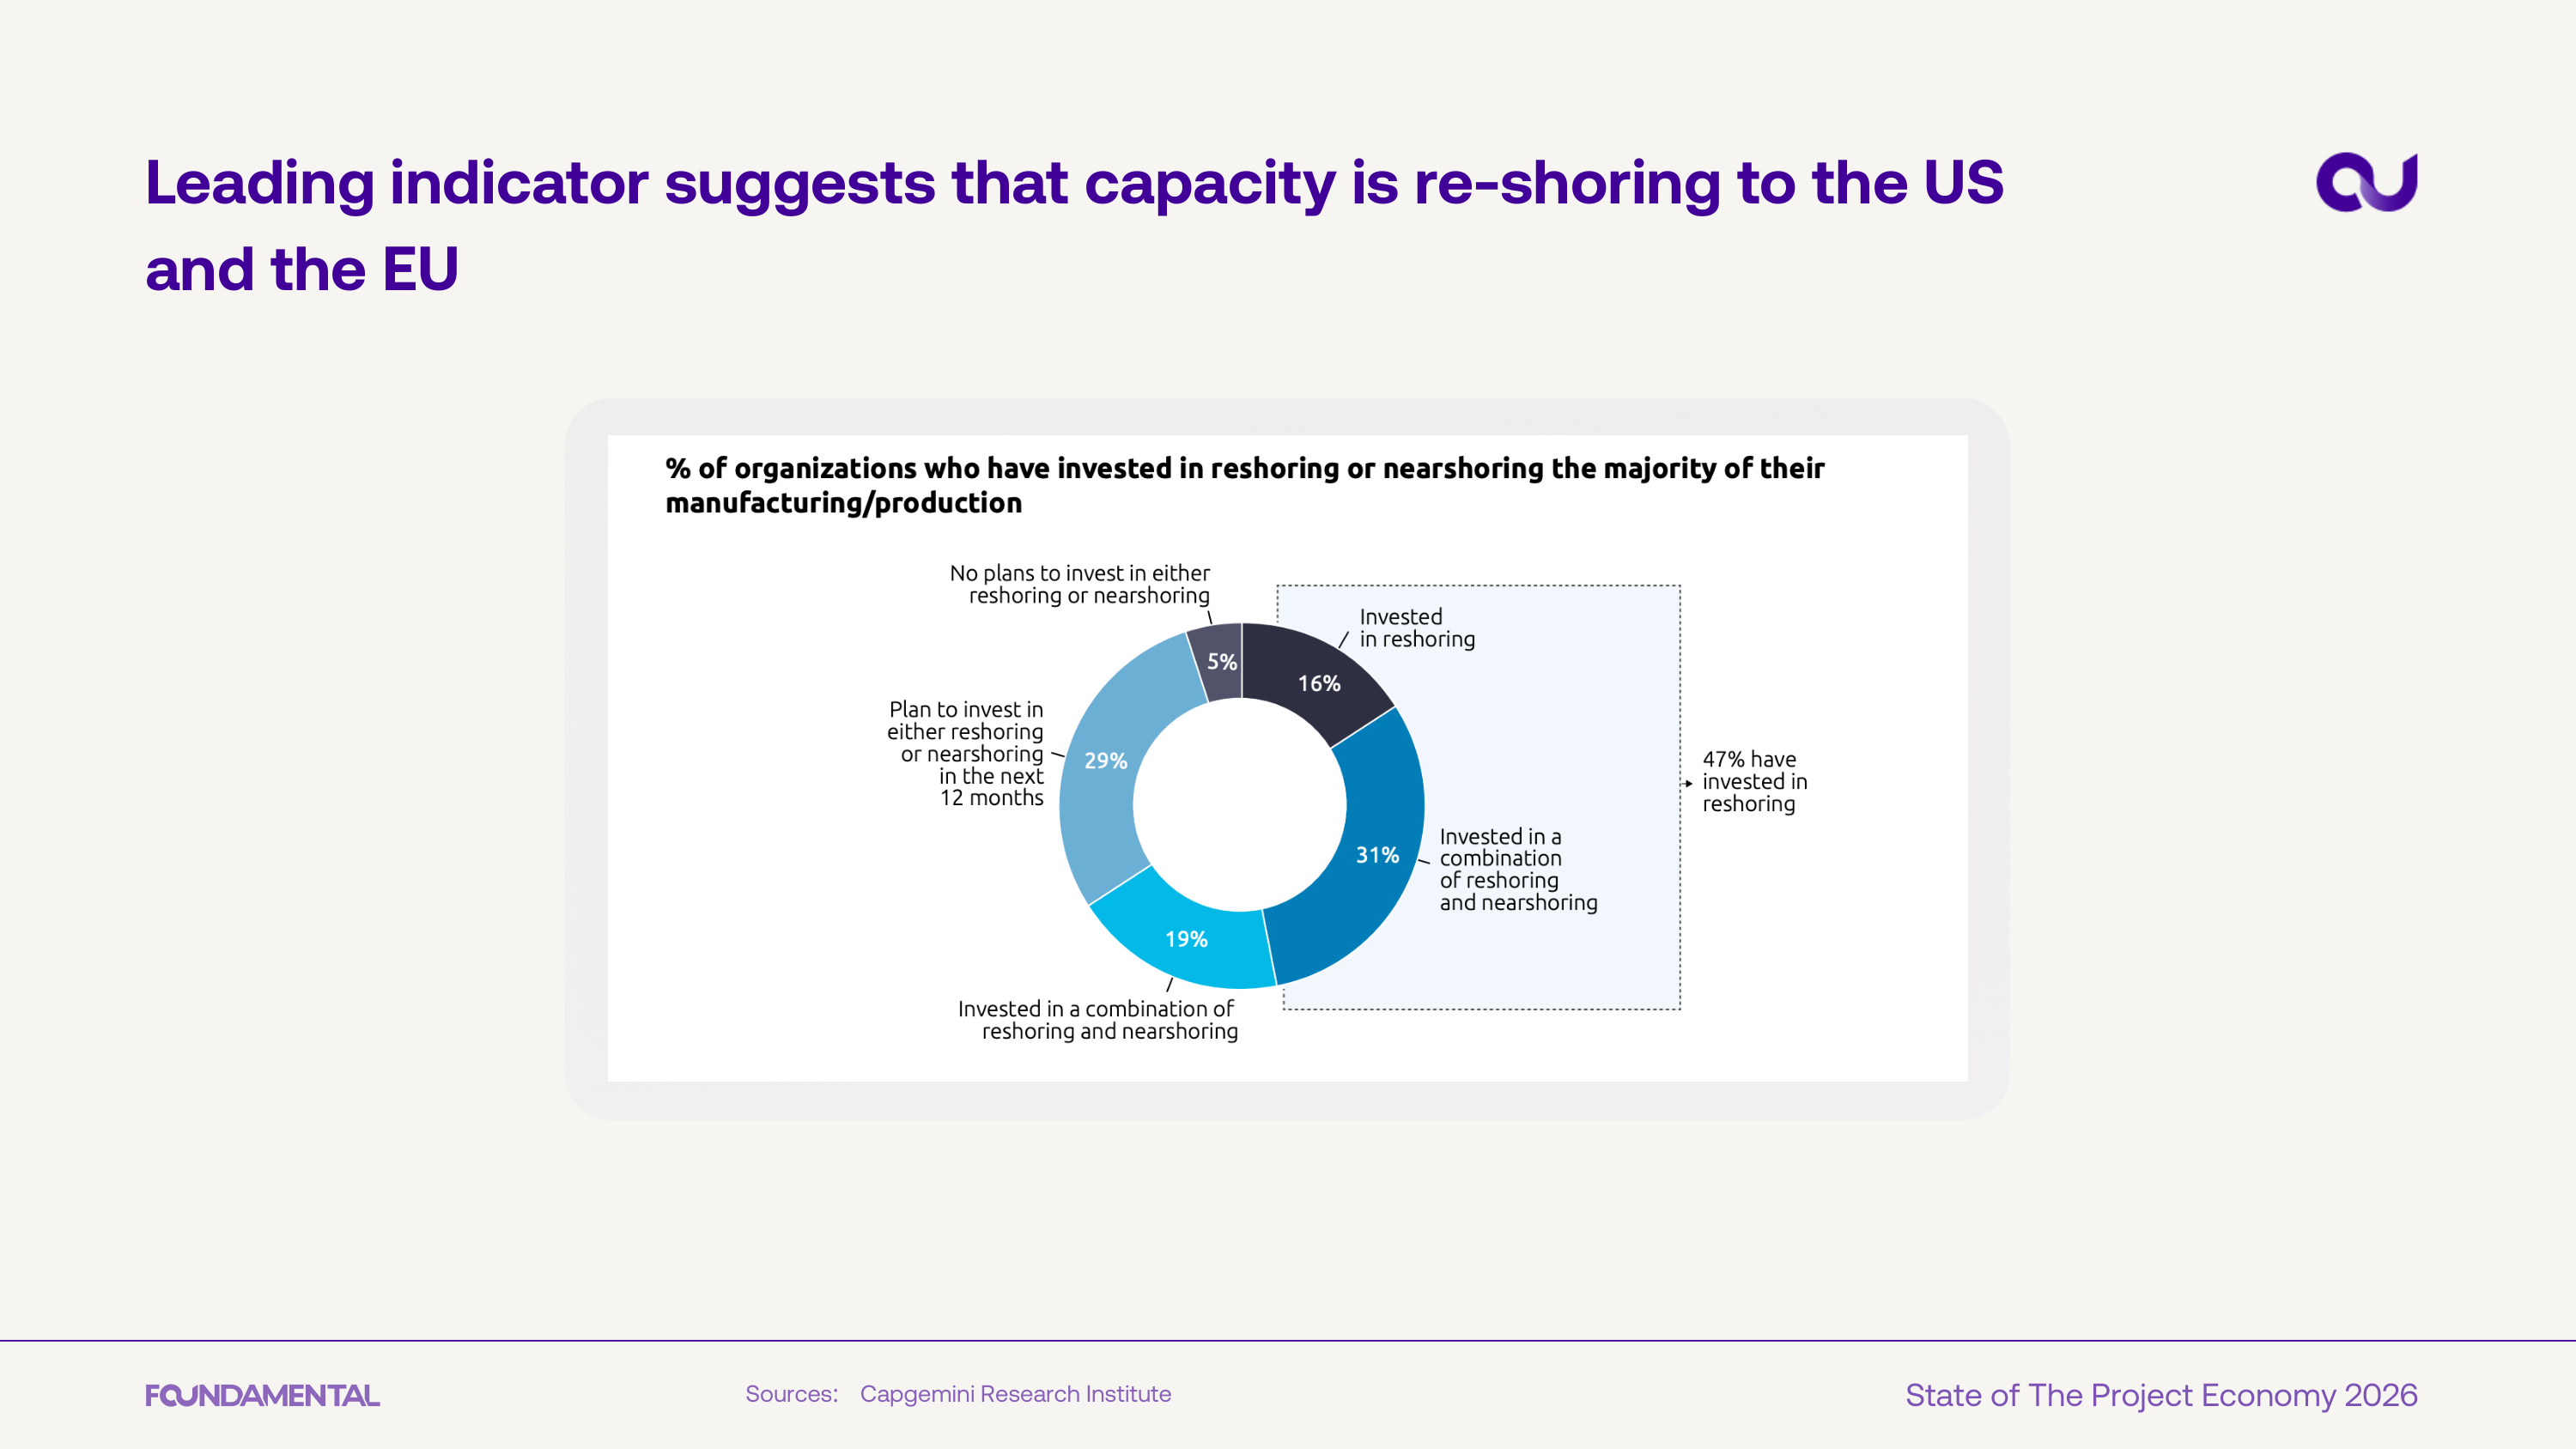
47% of organizations surveyed have already invested in reshoring or nearshoring their manufacturing capacity, with another 29% planning to in the next 12 months. Only 5% have no reshoring plans at all.
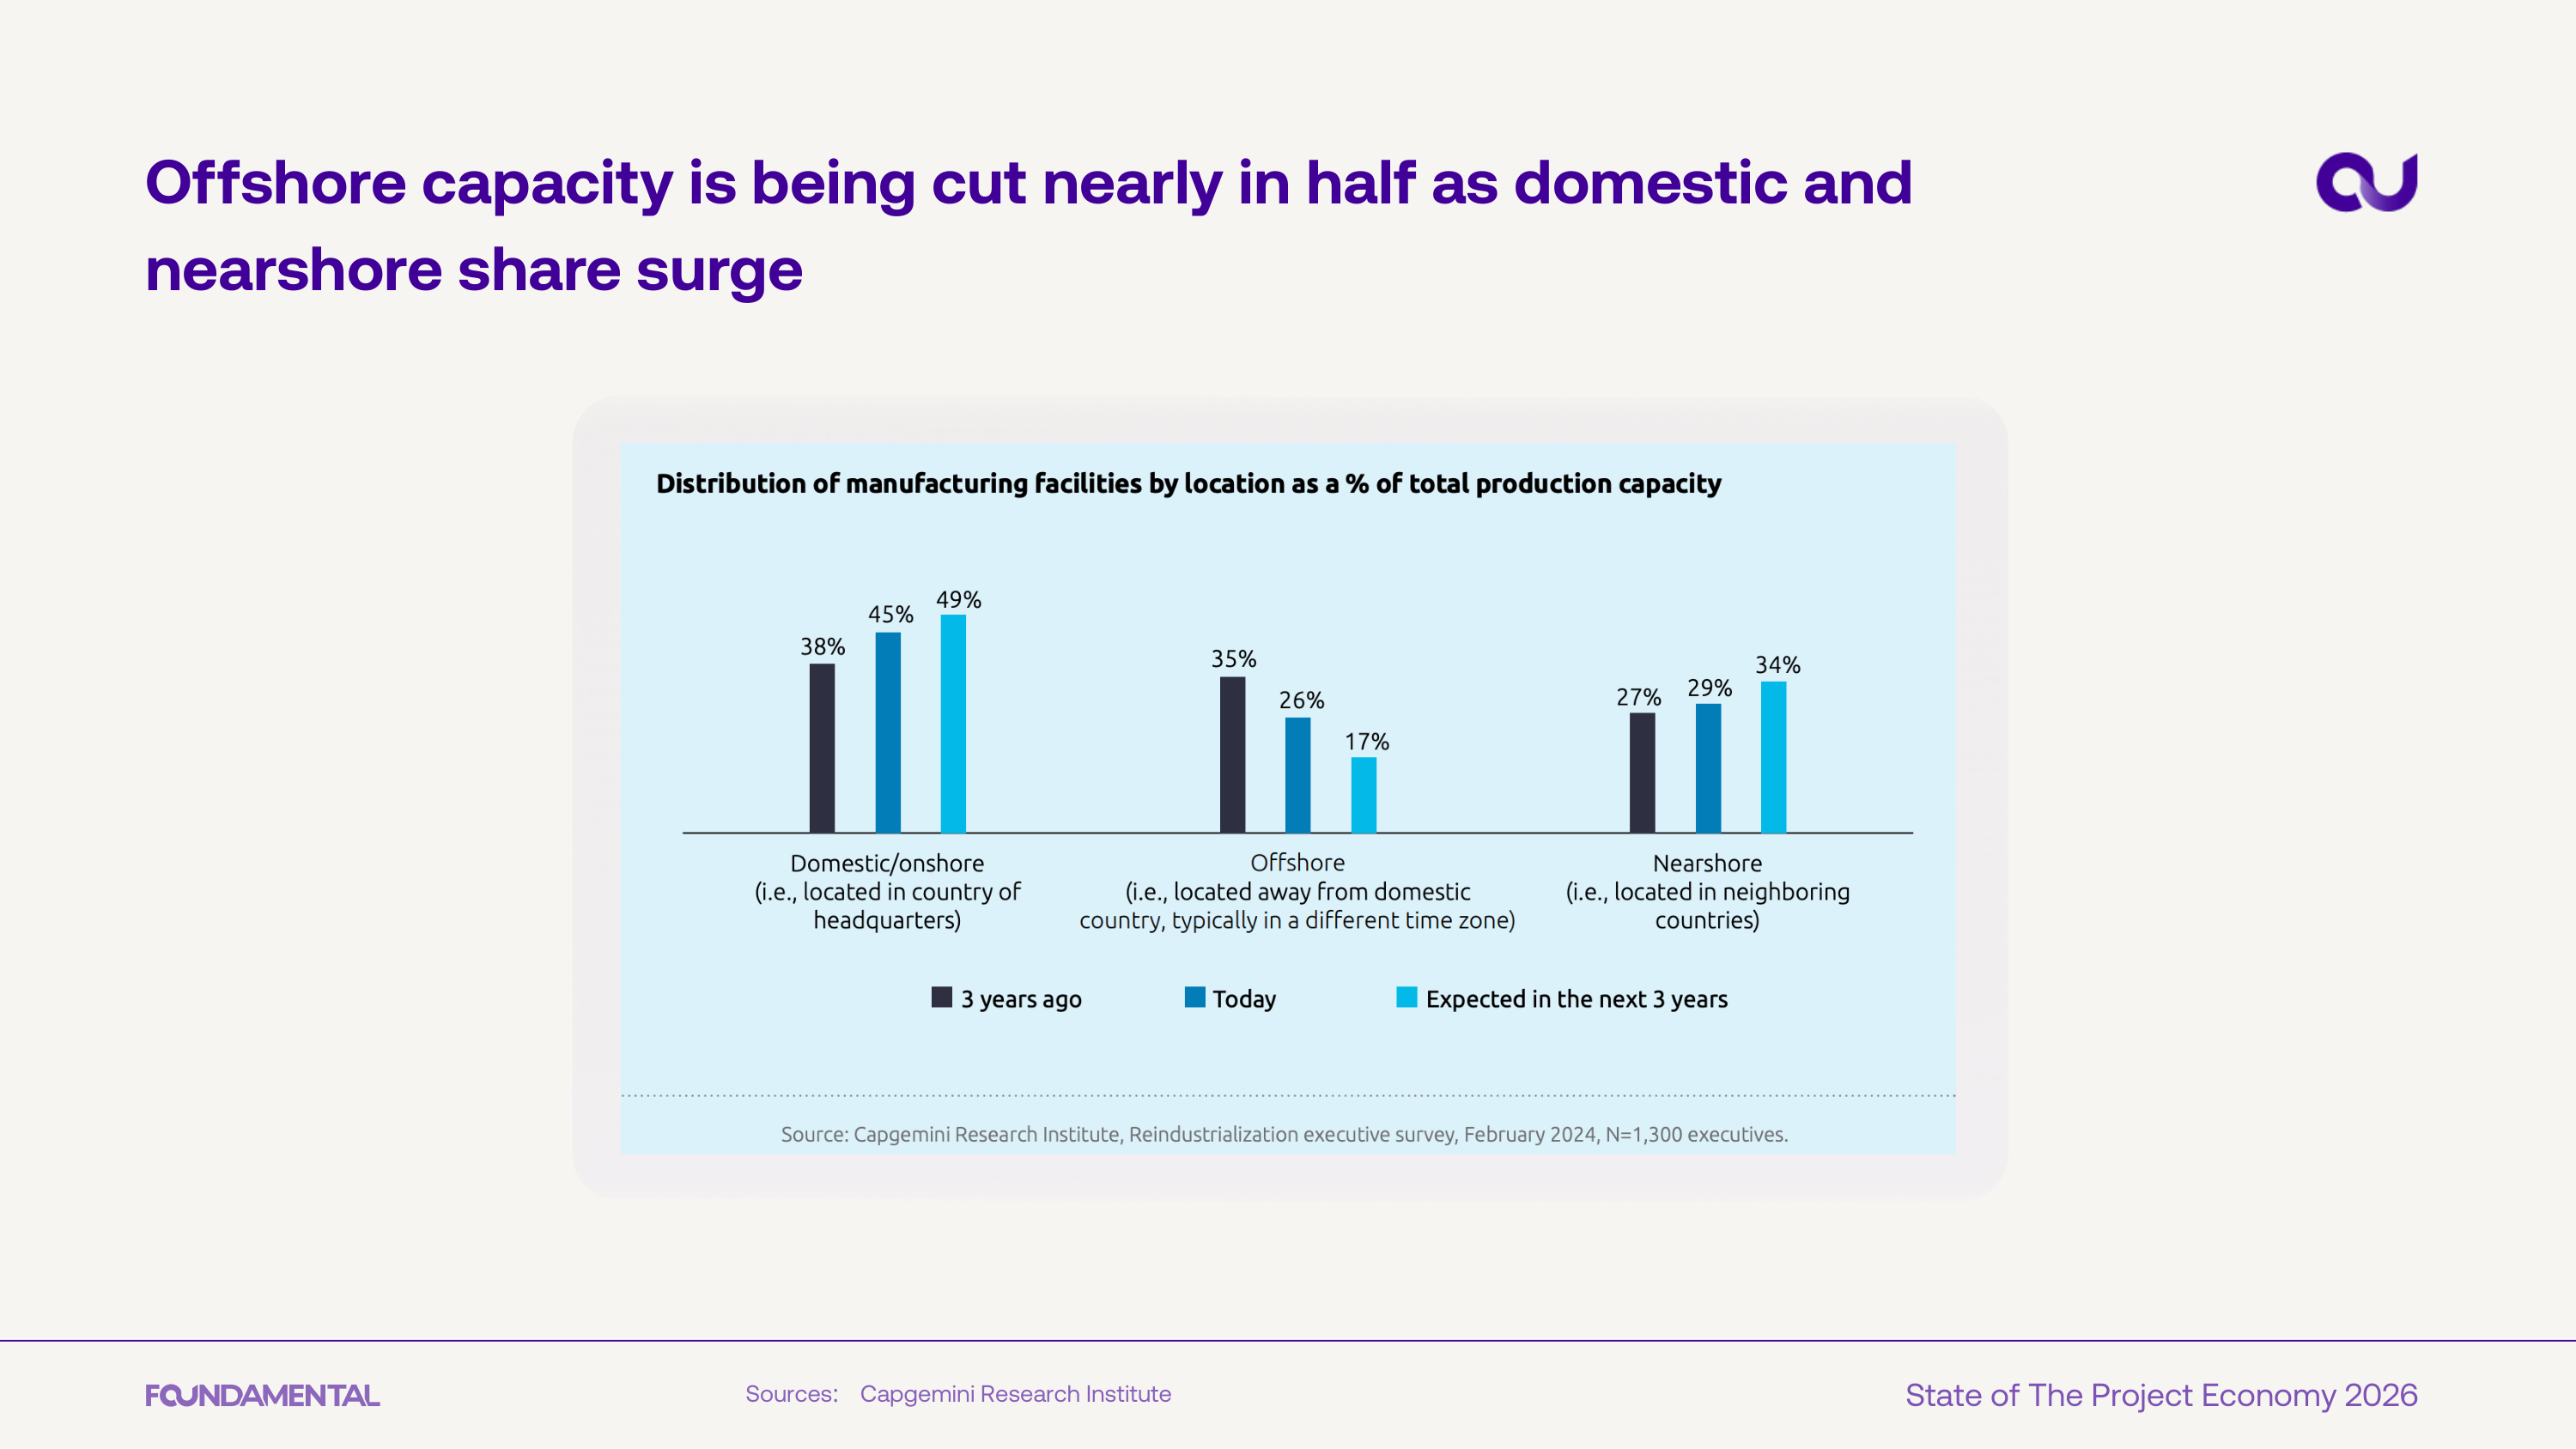
Offshore manufacturing capacity is being cut nearly in half - from 35% to a projected 17% - as domestic and nearshore shares surge. The shift represents a structural rewiring of global supply chains.
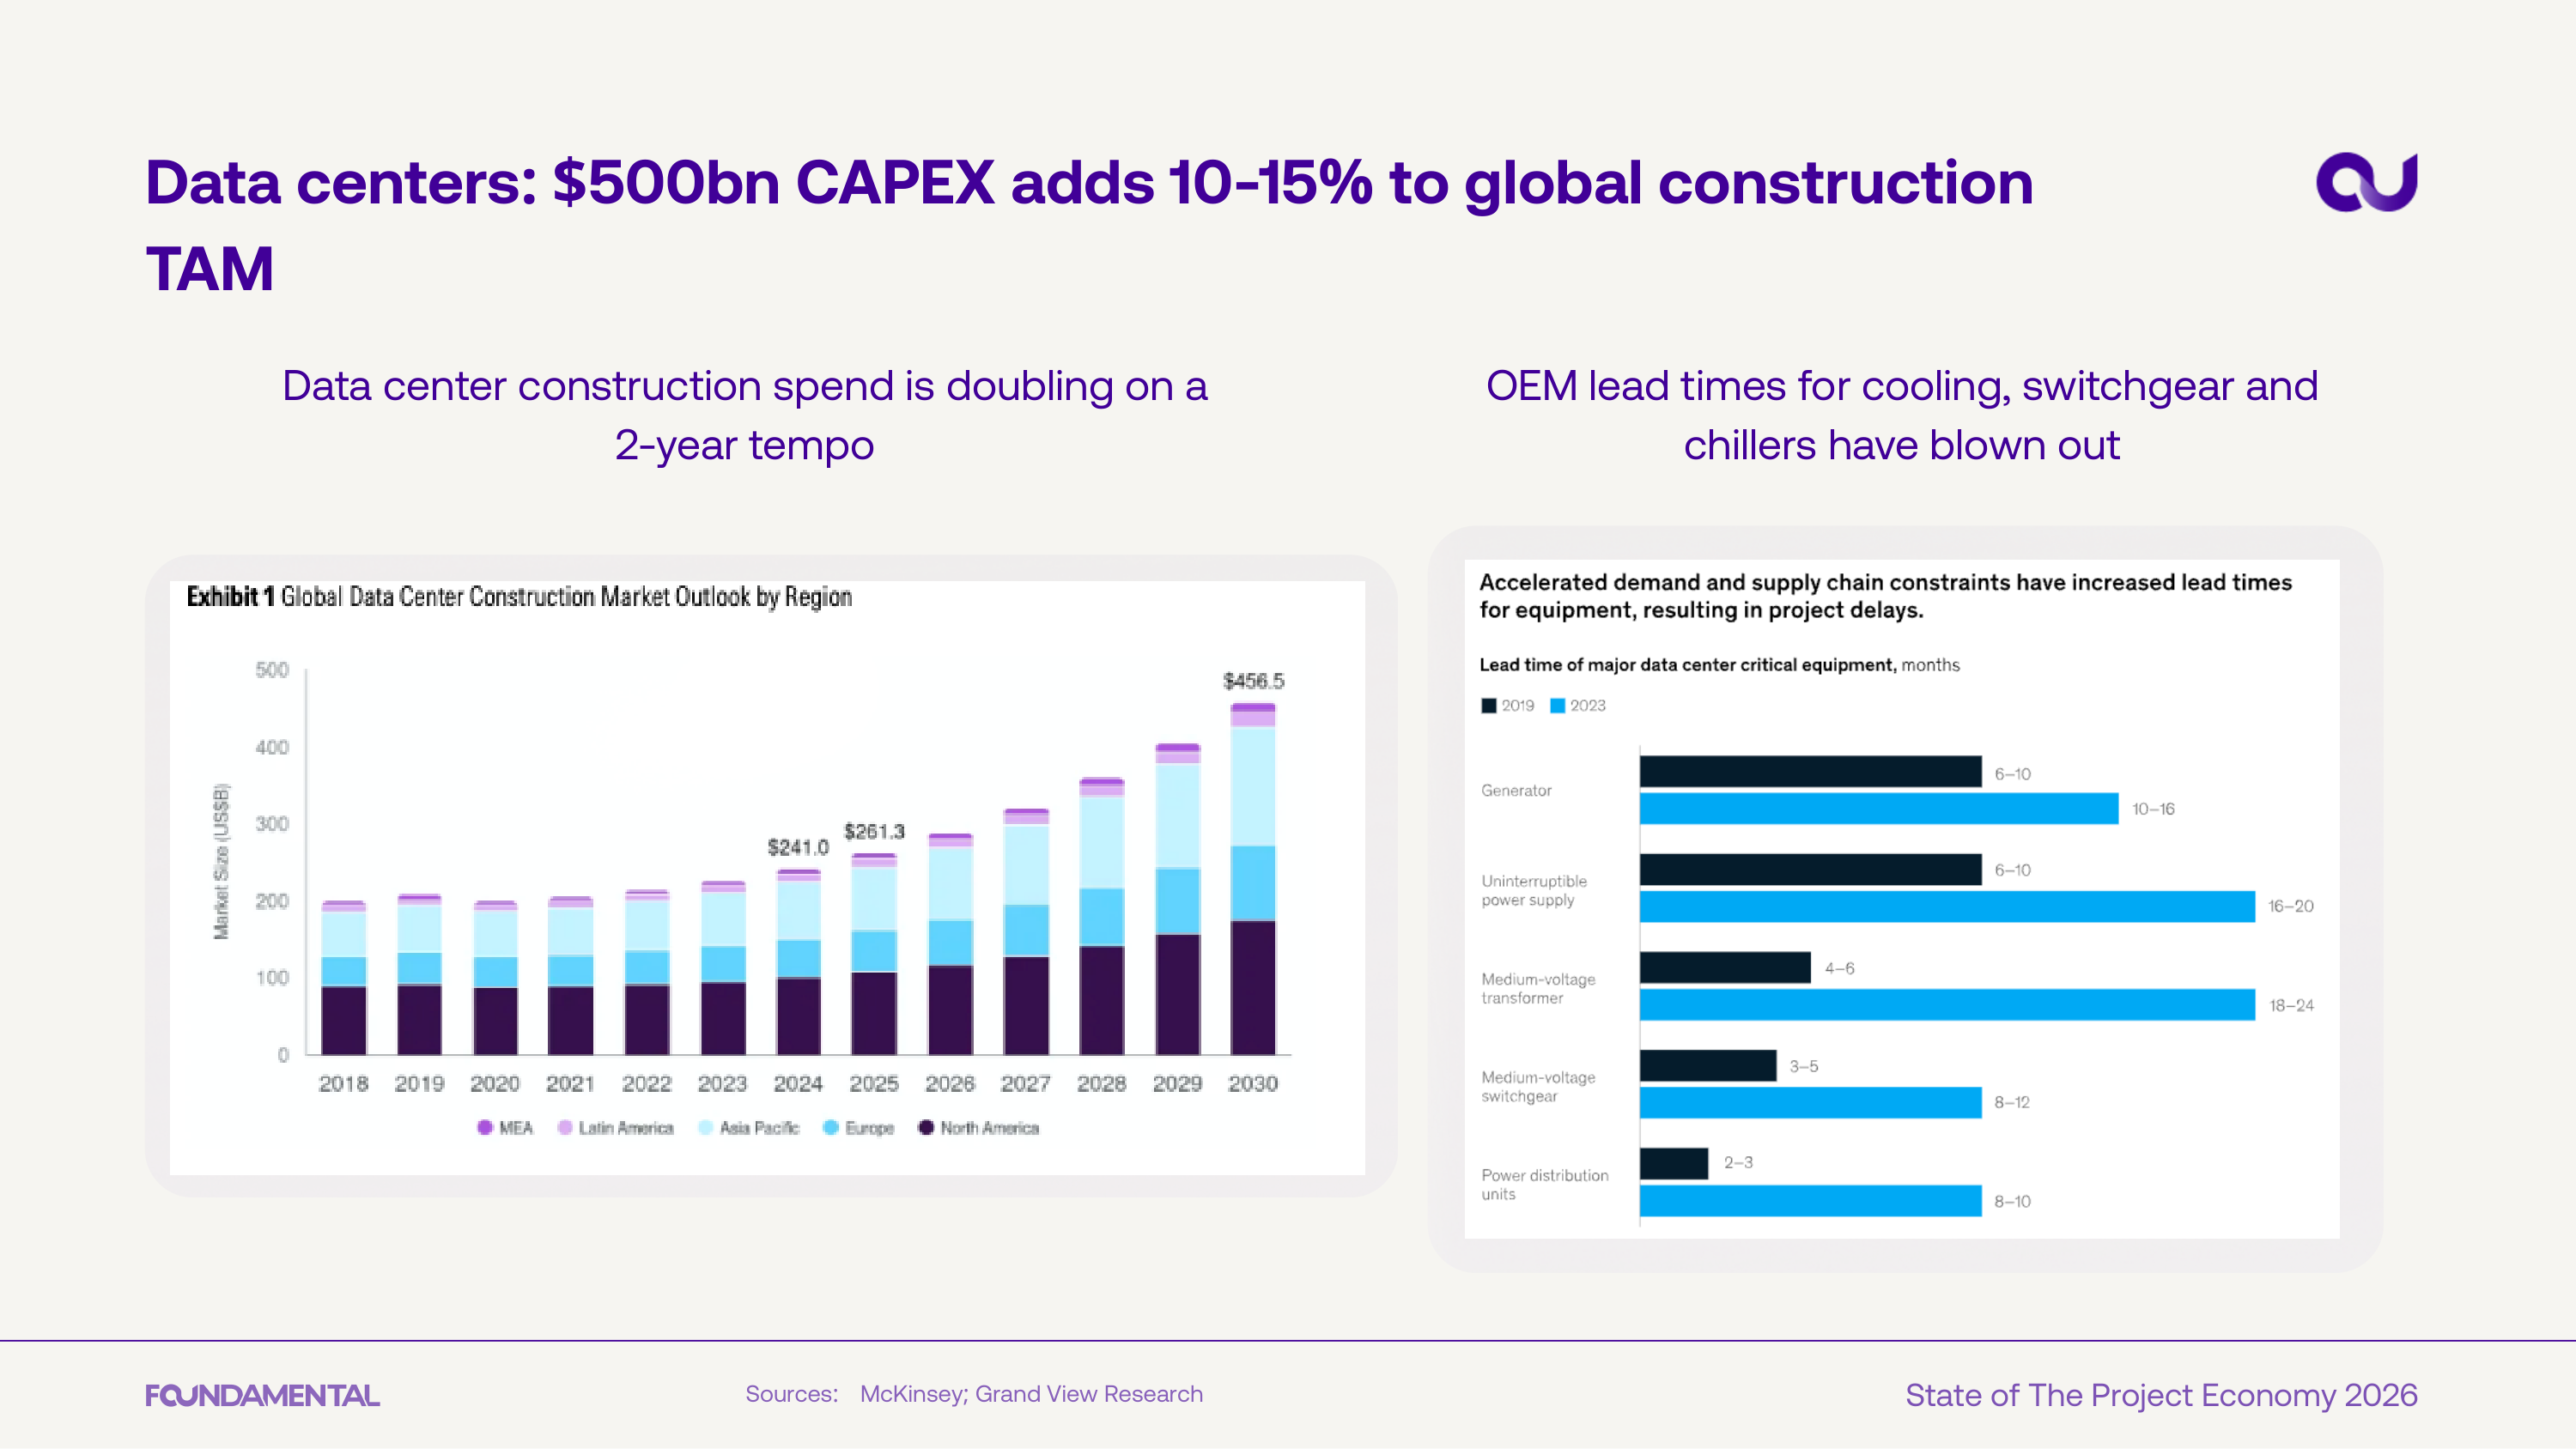
Data center construction spend is projected to reach $459.5B by 2030, adding 10-15% to global construction TAM. OEM lead times for critical equipment have roughly doubled, creating bottlenecks across the supply chain.
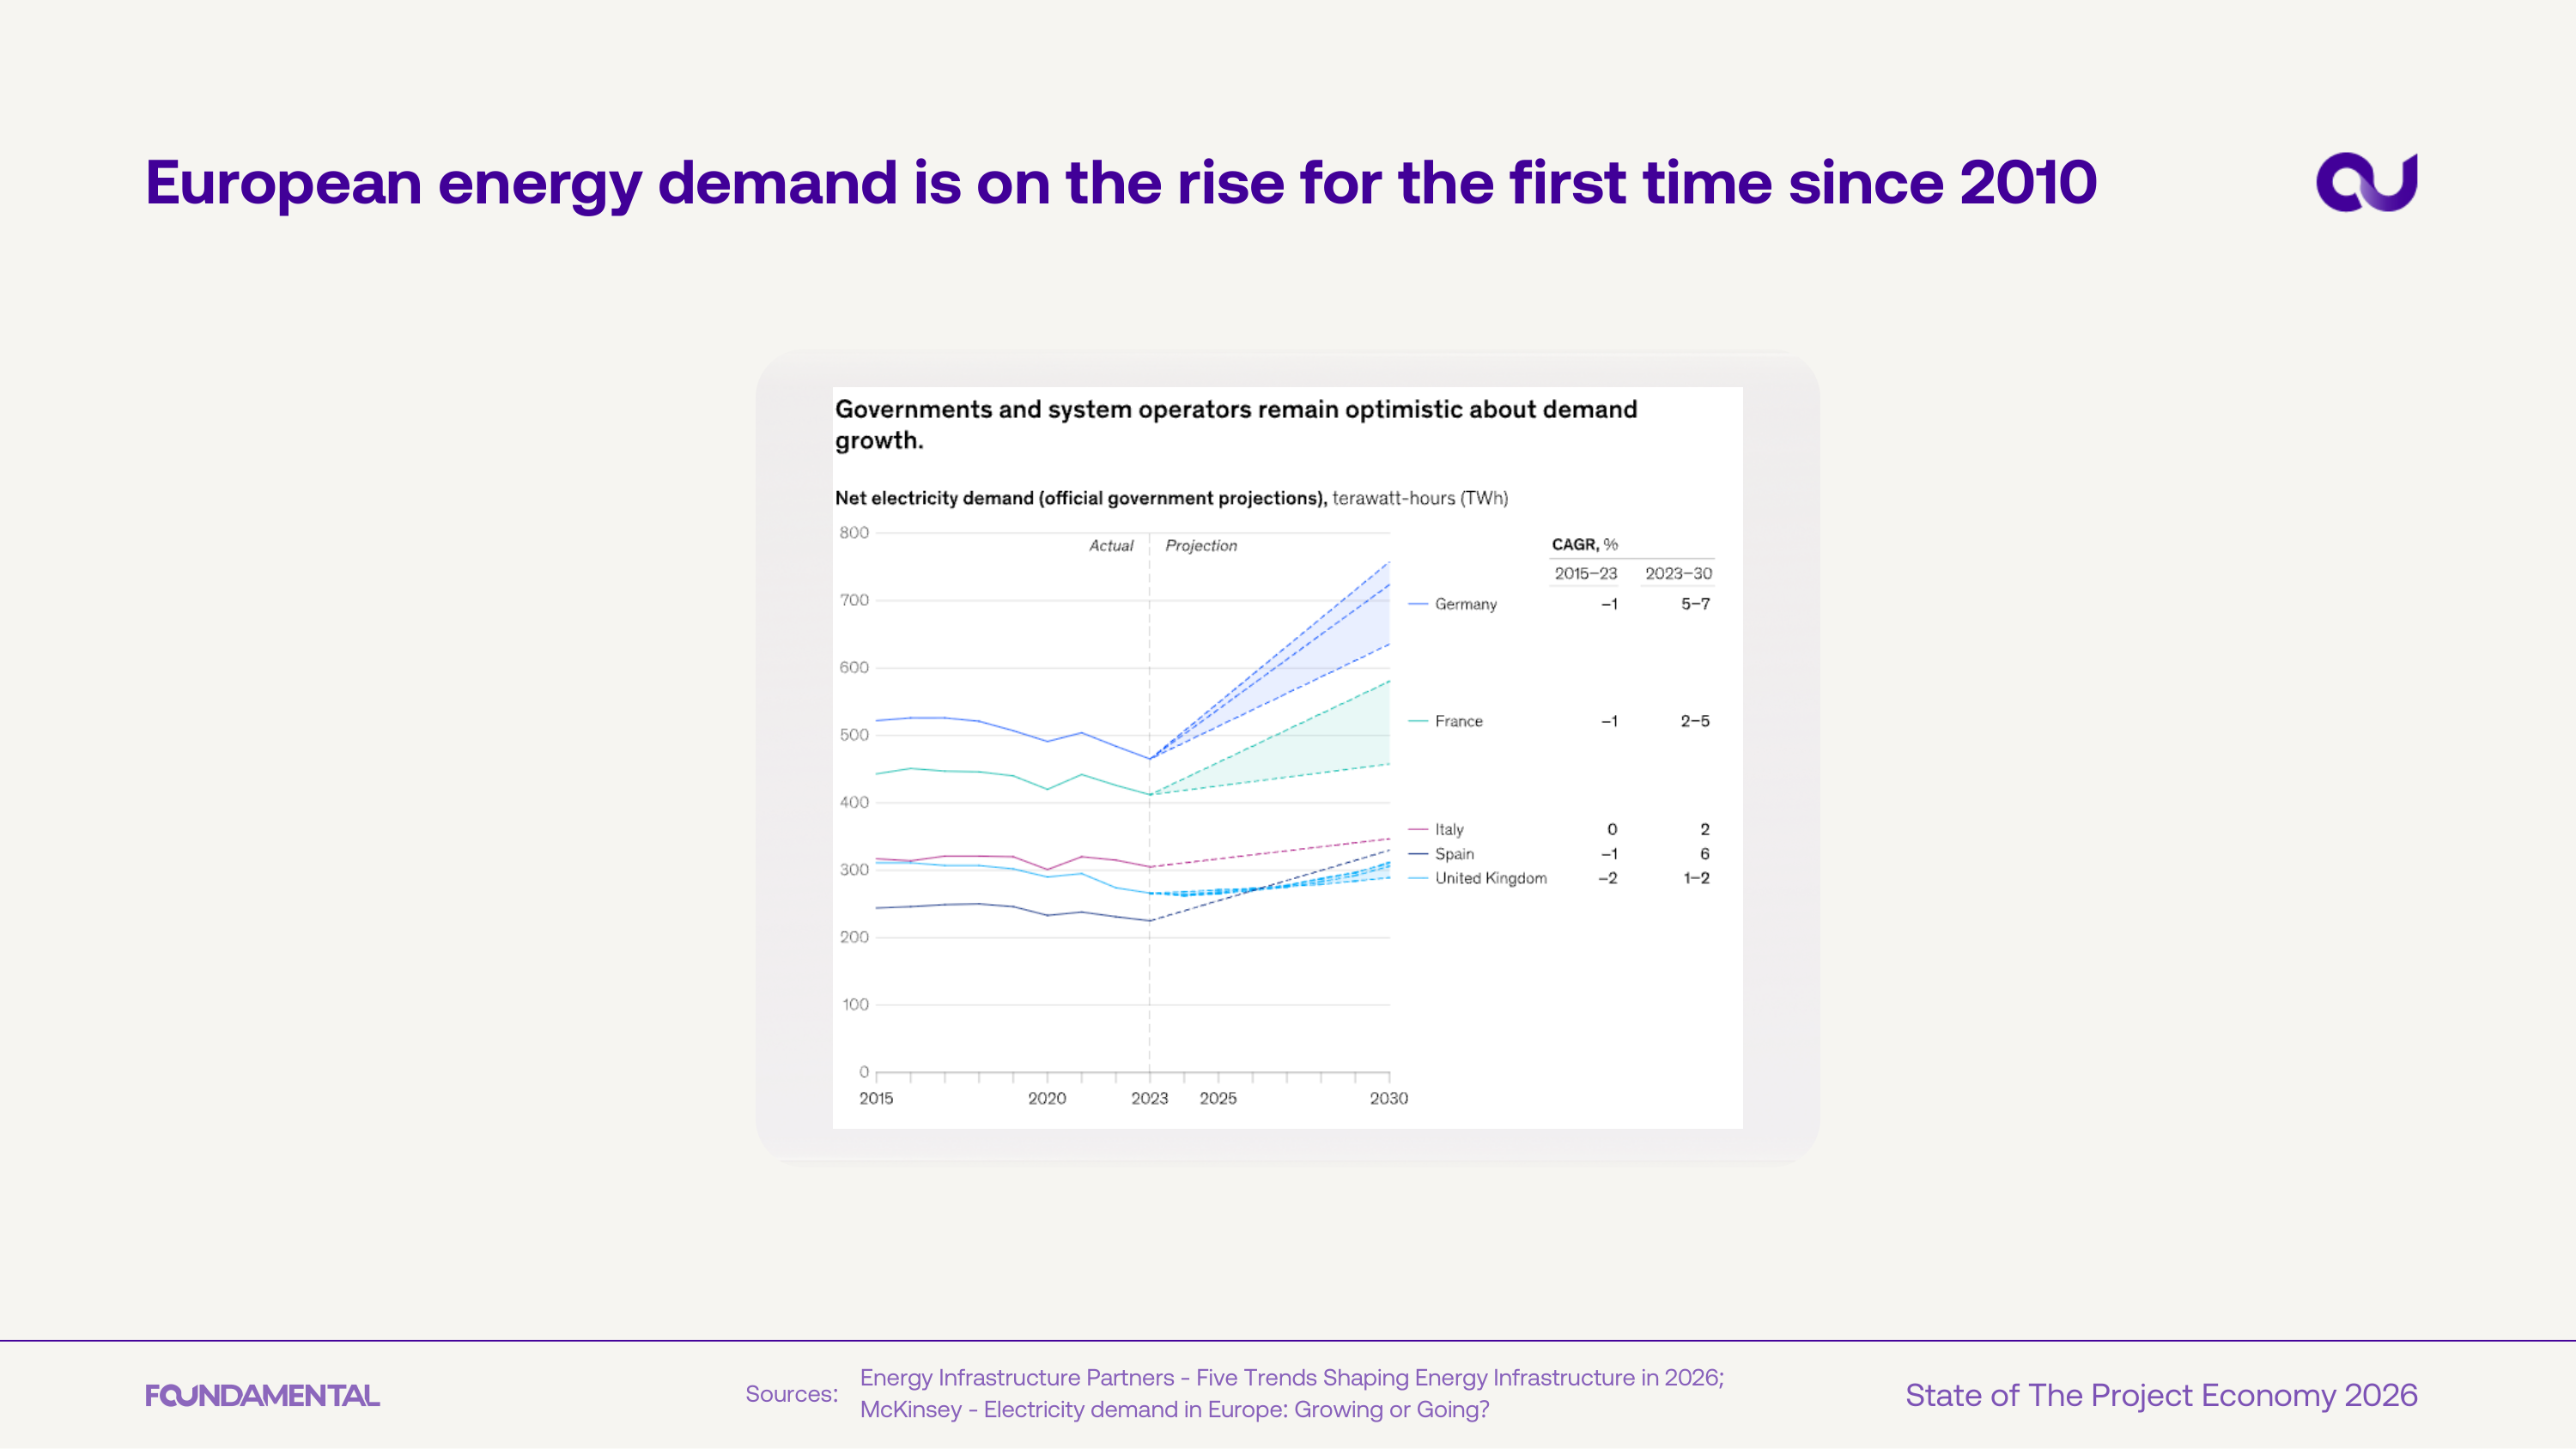
European electricity demand is rising for the first time since 2010, with government projections showing acceleration through 2030. Germany leads with a projected 5-7% CAGR in the coming years.
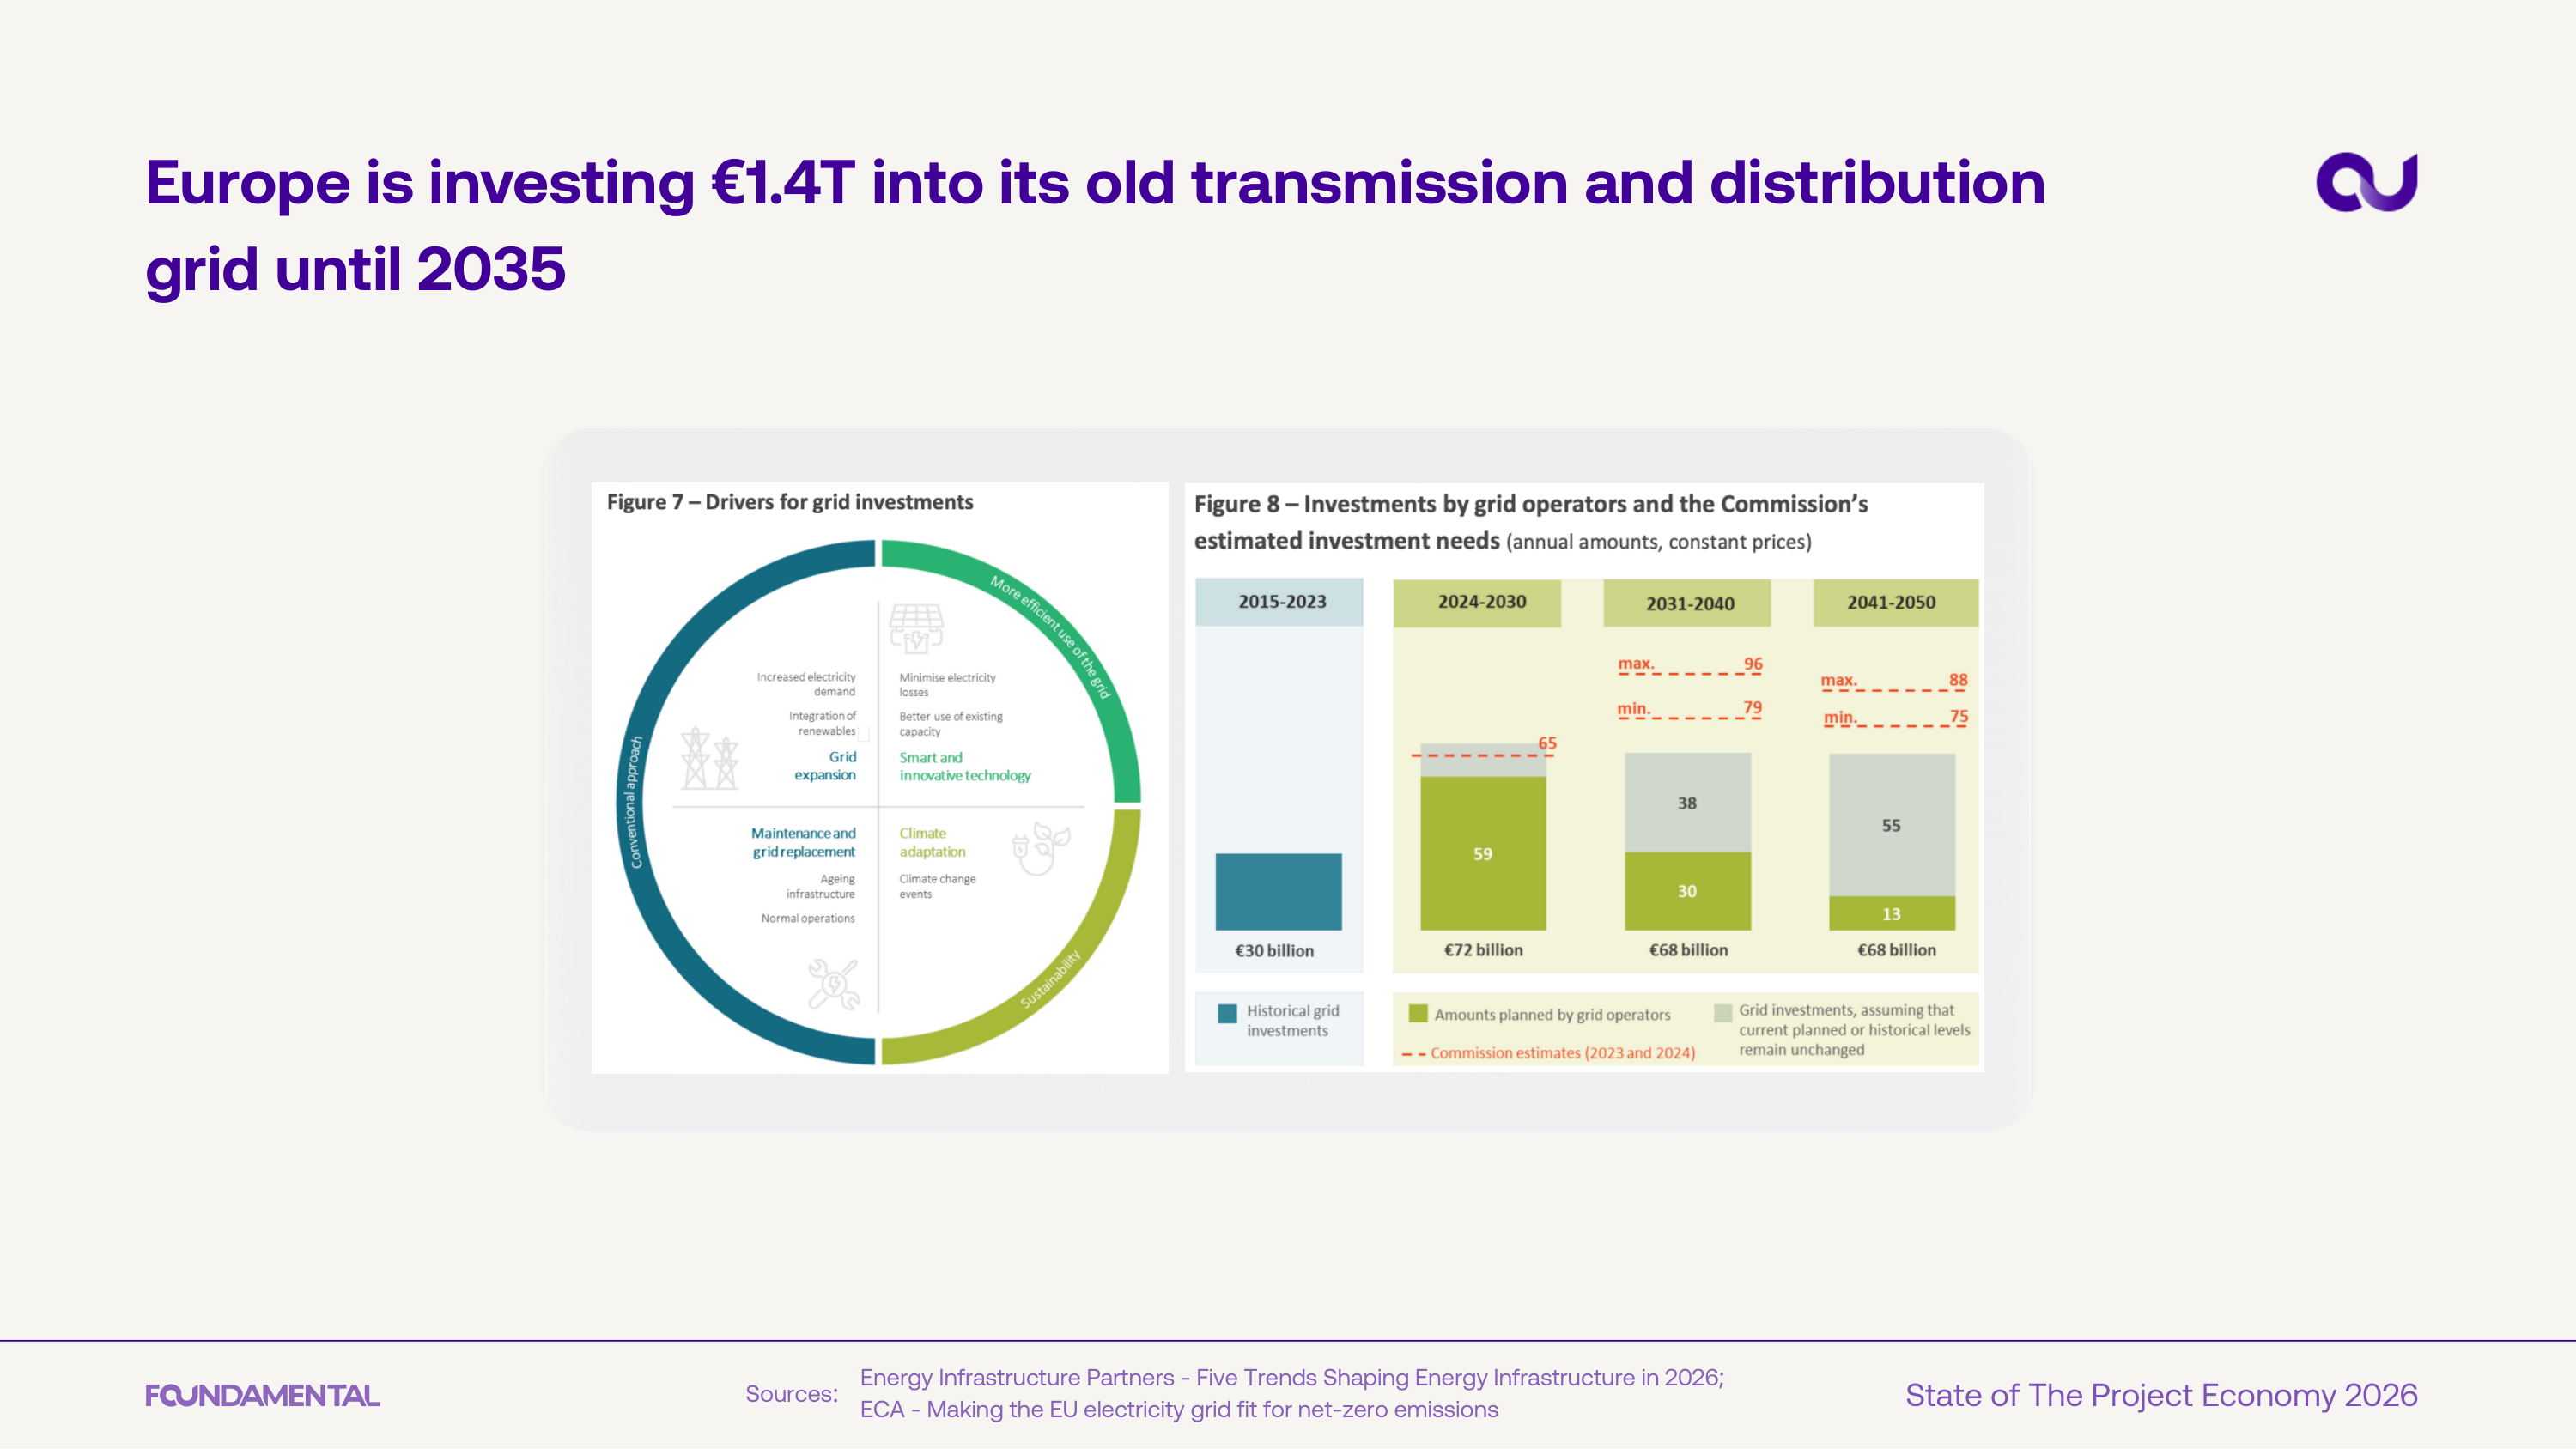
Europe is channeling 1.4T EUR into transmission and distribution grid upgrades through 2035, driven by net-zero targets and rising electricity demand. Annual grid investment needs are projected to roughly double by mid-century.

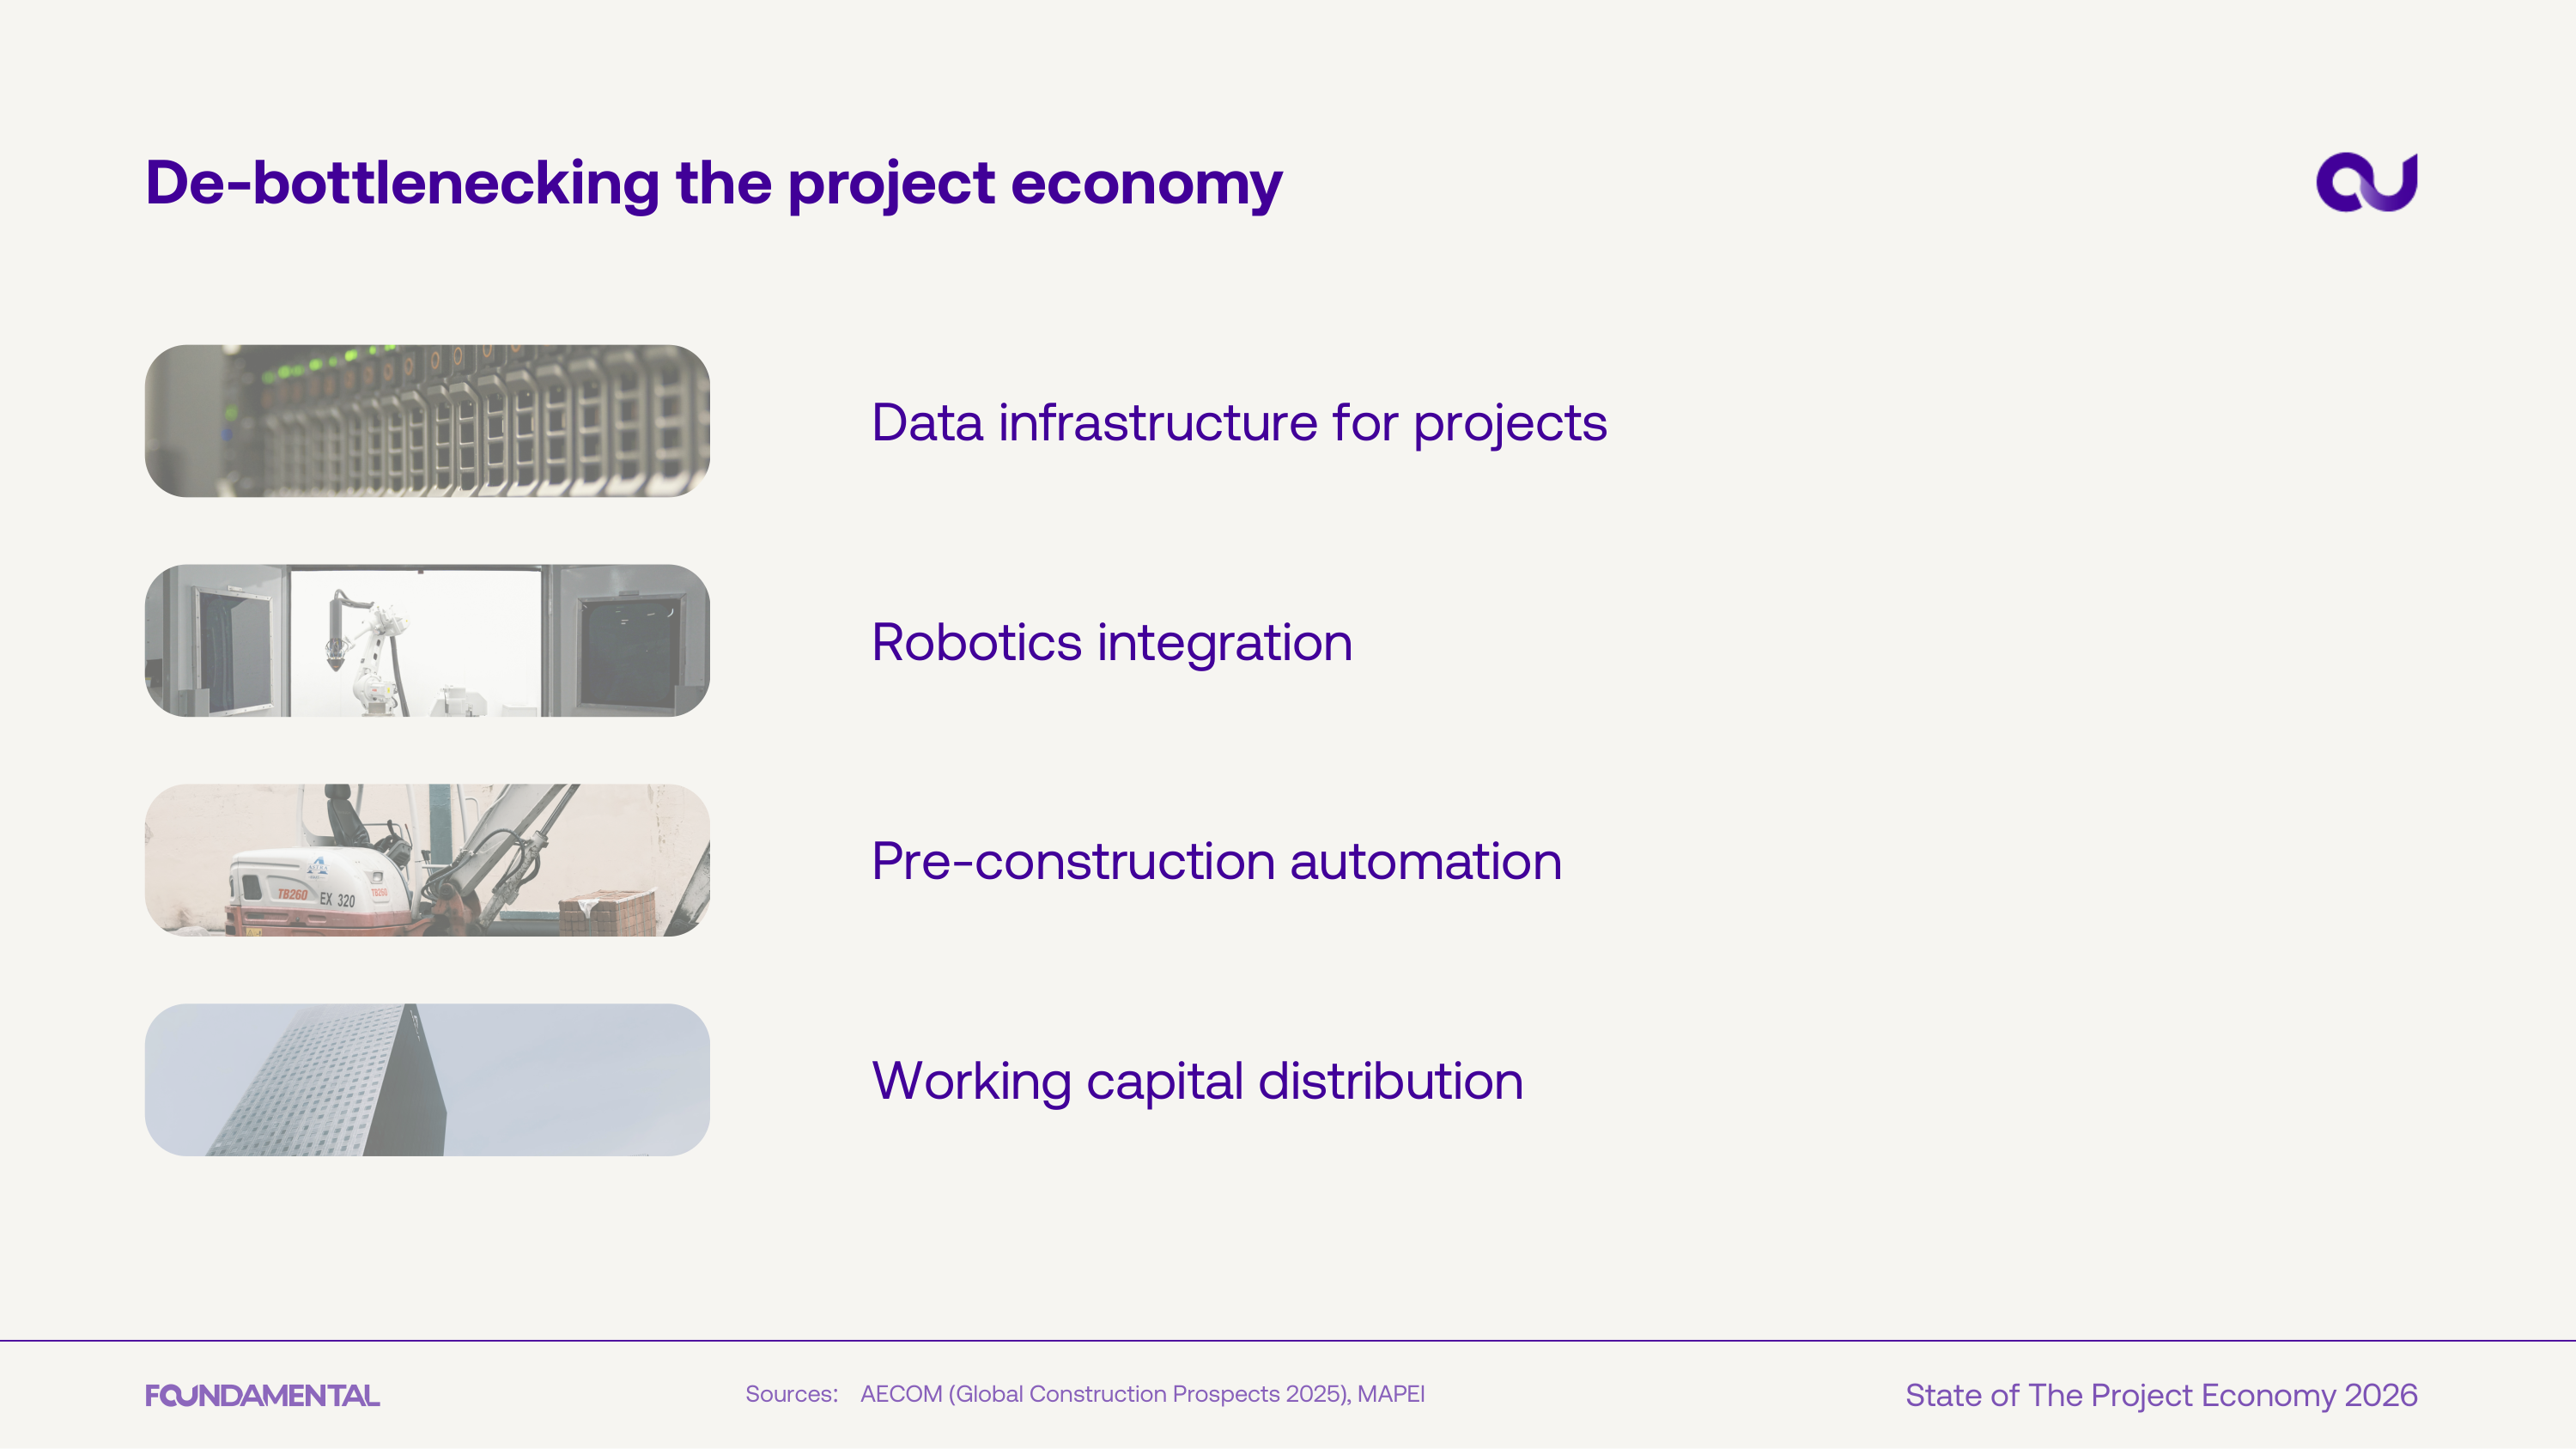
Foundamental identifies four technology categories for de-bottlenecking the project economy: data infrastructure for projects, robotics integration, pre-construction automation, and working capital distribution.
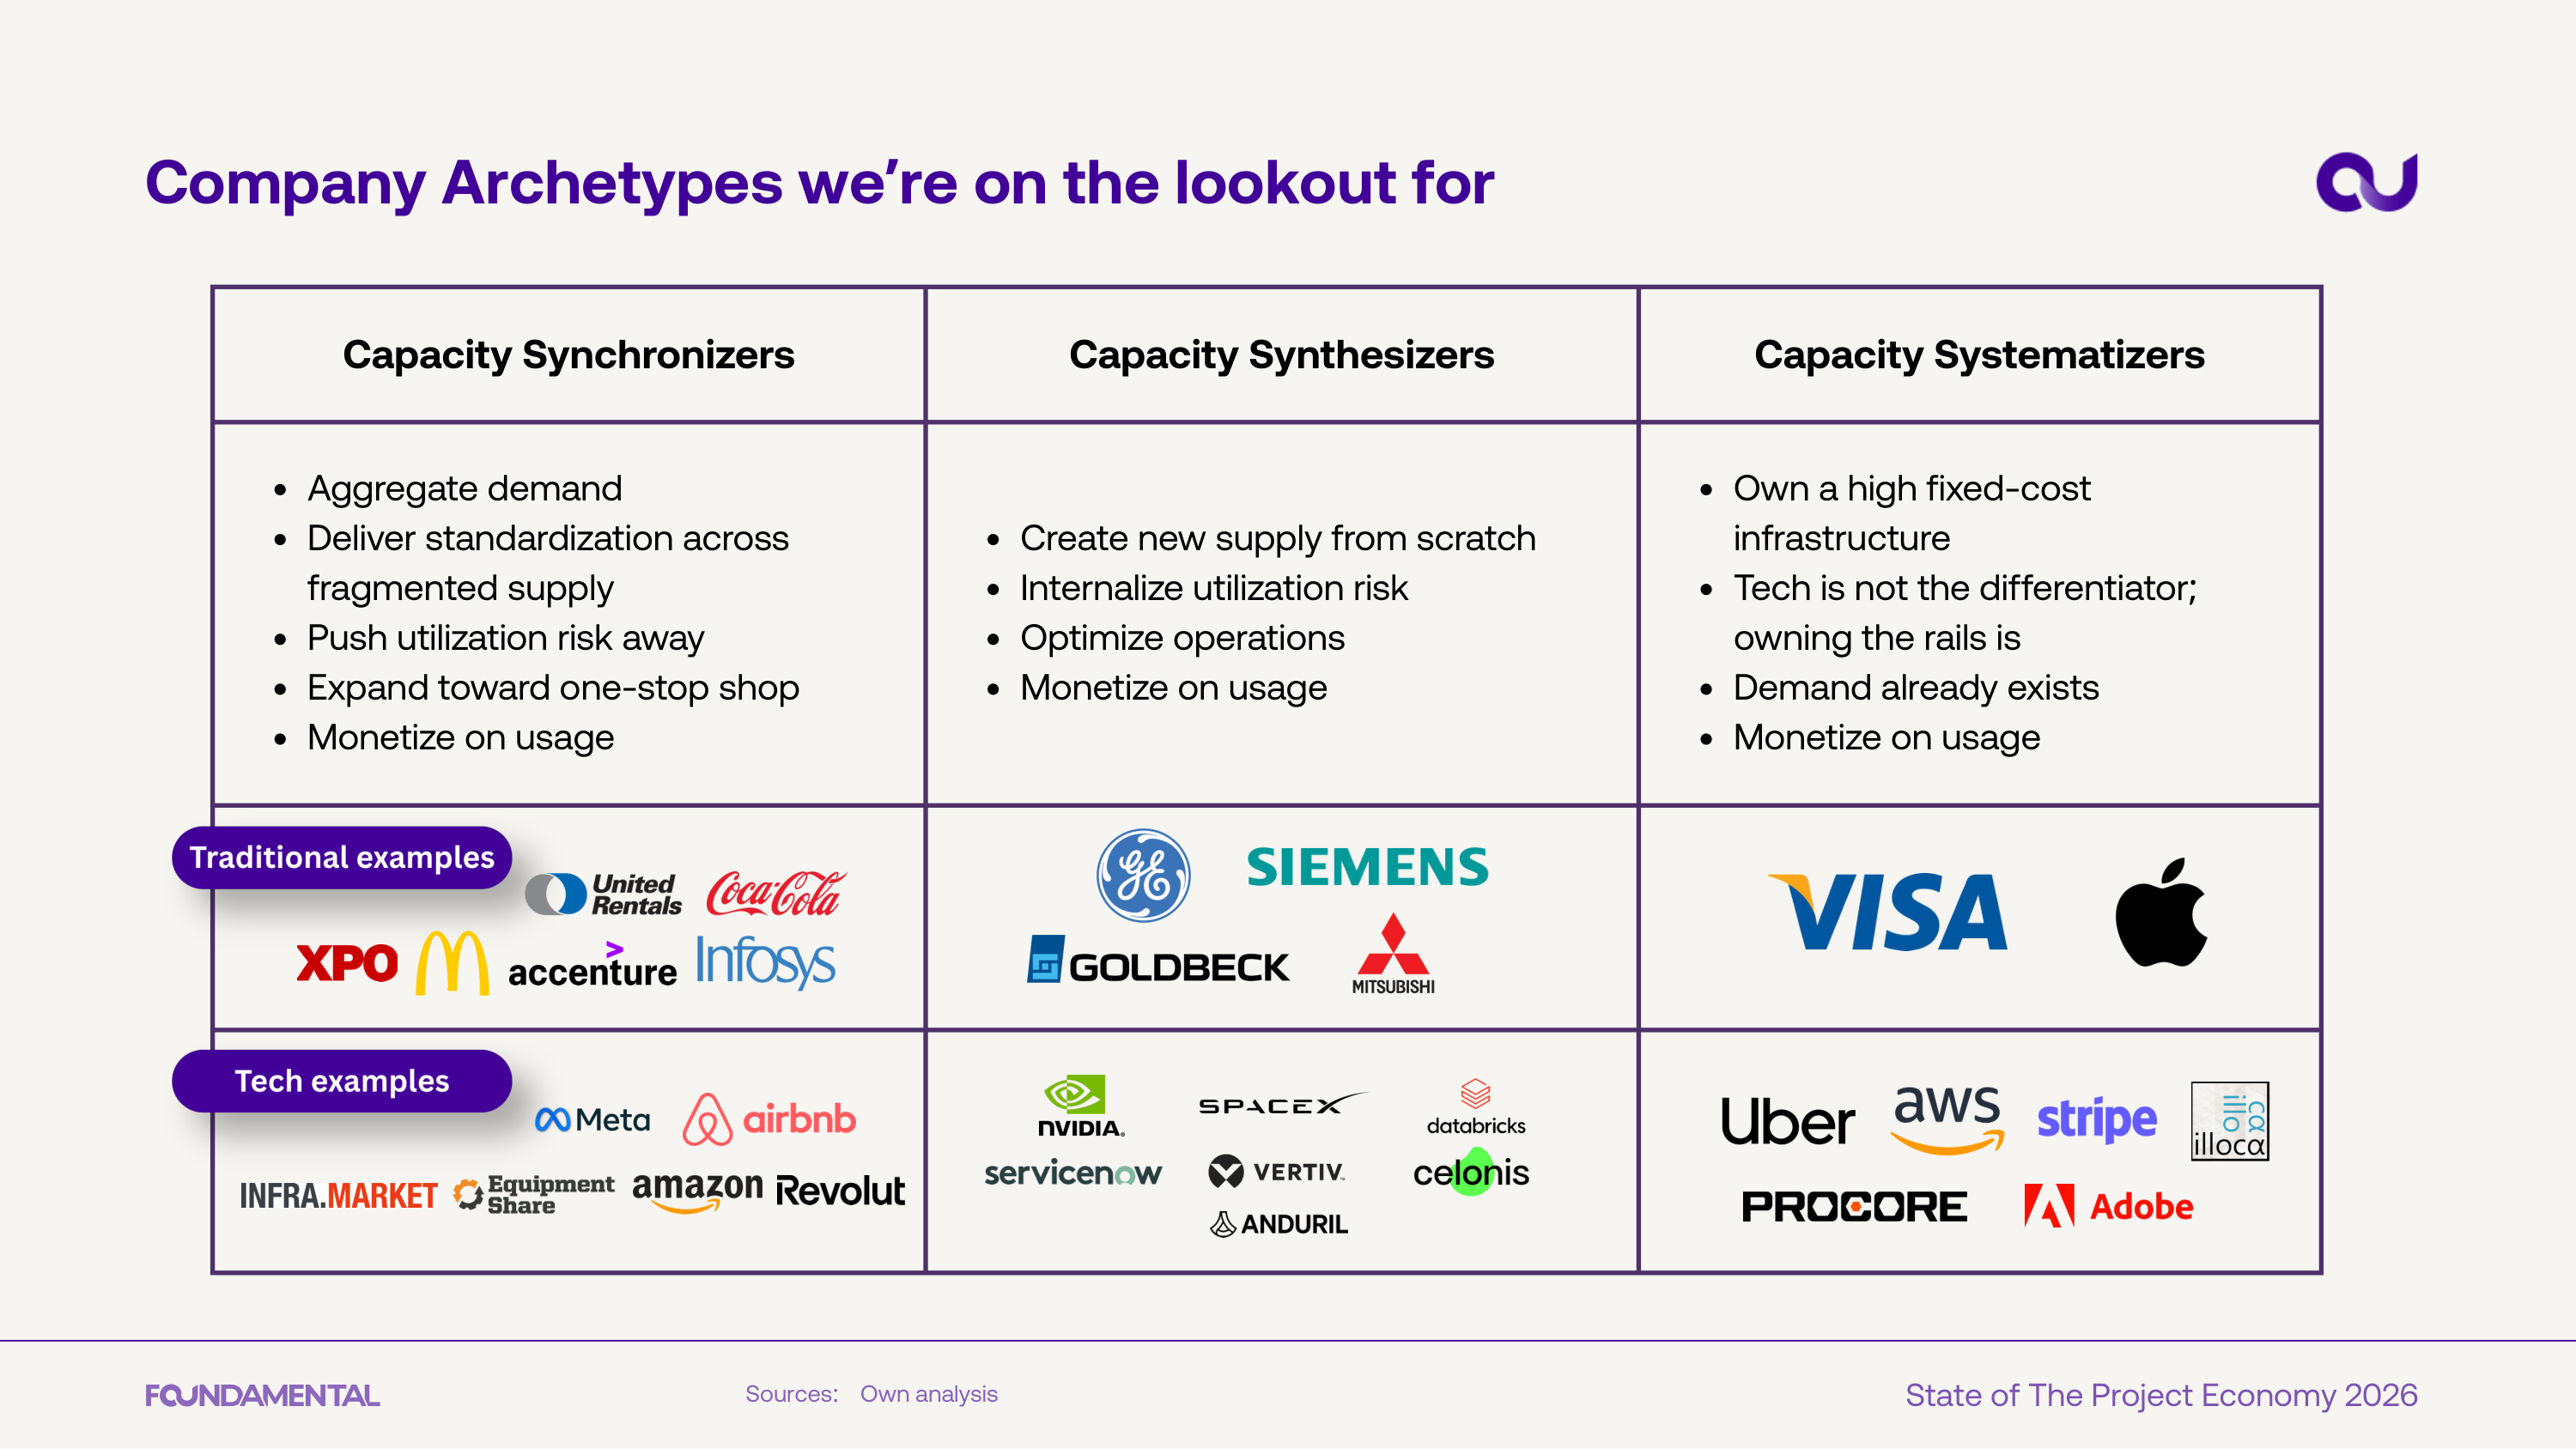
Three company archetypes for the project economy: Capacity Synchronizers (aggregating demand across fragmented supply), Capacity Synthesizers (creating new supply from scratch), and Capacity Systematizers (owning high-fixed-cost infrastructure rails).